The DustEx modelling tool
The DustEx model is used to assess exposure to semi-volatile substances (SVOCs) in products that are introduced into the indoor environment. The typical products considered are solid material products (e.g. flooring, wall covering, electronic devices) from which substances are released into indoor air and subsequently transported into different indoor compartments airborne particles, indoor surfaces and dust. Exposure takes place from the inhalation of the substance in the gas phase, the inhalation of substance bound to airborne particles, the dermal absorption of the substance from air (gas phase) and the oral ingestion of the substance with dust.
For SVOCs released indoors it may not be clear beforehand which exposure pathway(s) will be relevant. The DustEx model considers all pathways and will therefore enable a more complete assessment of exposure, reducing the probability of overlooking the most crucial pathways in the exposure assessment.
In developing the DustEx model, a number of simplifying assumptions was made. These put limits on the applicability of the model in exposure assessments. The assumptions on and limitations of the model are described in the section ‘model assumptions and limitations’
A description of the model is given here.
Practical guidance on how to use the tool is given here.
A description of how to run a simulation and view its results is provided here.
If you have questions or suggestions for the improvement of DustEx, please contact us at dustex@rivm.nl.
Model framework
The DustEx model is a kinetic source to dose model that contains dynamic mass balance equations describing emission and fate of the substance indoors. The integration of the system of equations using suitable boundary and initial conditions (i.e. reflecting the specific exposure scenario), gives the concentrations of a substance in all different compartments (air, product, dust, airborne particles, indoor surfaces) as a function of time. Estimates of the concentration in the different indoor compartmens are combined with equations estimating exposure from contact with these media.
].
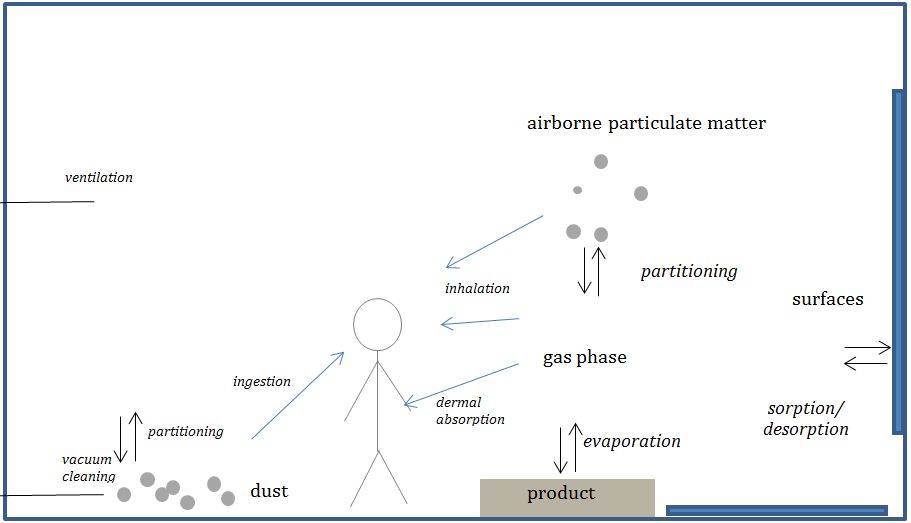
A graphical representation of the components and physical processes considered in the kinetic source to dose model. The substance is emitted from the product into bulk indoor air by evaporation. From air, the substance will partition to airborne particulate matter, dust and will sorb to indoor surfaces. Removal of the substance from the indoor environment takes place via ventilation and vacuum cleaning. Exposure of a person present in the indoor environment stems from the inhalation of the substance in gas phase and bound to particles, the dermal absorption of the substance from air (gas phase), and the ingestion of the substance with dust.
Equations describing emission and transfer of a substance indoors
The emission of an SVOC from a product and the subsequent transfer of the substance into the indoor environment is governed by different processes. In the model these processes are described by mass balance equations. The processes include:
- Emission of the substance from the product
- Transfer into house dust
- Transfer from air to indoor surfaces
- Transfer to airborne particulate matter
These processes combined determine the gas phase air concentration
Emission of the substance from the product
Emission of SVOCs from a product into air is generally understood to result from two subsequent processes: first, the partitioning of the substance between the product material and the air in direct contact with the product (evaporation). Second, the substance’s transfer over a stagnant boundary layer of air over the product surface into bulk indoor air by diffusion (Xu and Little 2006).
The concentration in the air in direct contact with the product (yo) is assumed to be determined by the material/air partition coefficient Kma (unitless) and the concentration in the product Cprod (mass/volume) as:

The transfer of the substance into bulk air is characterized by the mass transfer coefficient hm (distance per time) times the concentration gradient overthe boundary layer. Combined, the rate of change in the air concentration Cair due to evaporation is given by:

where Vroom is the volume of the room, and Sprod the surface area of the product in contact with air.
This description is valid only for SVOCs, since for these substances the slowest, rate-determining step is the transfer from the product to air. For more volatile substances, the emission is also determined by diffusion of the substance within the product matrix (Xu and Little 2006).
Transfer into house dust
Weschler and Nazaroff (2008) demonstrate that the transfer of a substance into house dust can largely be explained by the emission of the substance into air and subsequent partitioning of the substance between air and dust. The partitioning of a substance between the gas phase and dust can be described using the dust/air partition coefficient Kda. According to Weschler and Nazaroff (2008) Kda depends on the organic material content of house dust, fom,dust and the octanol-air partition coefficient Koa according to:

The rate of transfer between dust and bulk air is described by the mass transfer rate hm. Weschler and Nazaroff (2008) assume hm to be the same as for the transfer from the product to air (see equation (2)).
The concentration of the substance in dust Cdust (mass of substance/volume of dust) is reduced by the removal of substance contaminated dust by vacuum cleaning and track out of dust and the replacement by clean dust, maintaining a fixed amount of dust indoors. The removal of substance with dust is modelled with a dust elimination rate coefficient kel,dust (per time) that summarises these elimination processes into a single parameter:

Combining the two processes (transfer between air and dust and the removal with dust) gives

with Sd and Vd the total surface area and the volume of indoor surface dust, respectively. The volume of dust is estimated from the surface area of dust-loaded surfaces, the dust surface loading and the density of dust.
Transfer from air to indoor surfaces
Following Weschler and Nazaroff (2008), sorption to surfaces such as furniture, flooring and windows is conceptualized as transfer to and partitioning into a thin film of organic material on these surfaces. Sorption is determined by the affinity of the substance for the organic material in the surface film. The partitioning between air and the organic film can be approximated by the Koa. The rate of transfer of the substance from air to the surface film is furthermore determined by the mass transfer rate hm. Weschler and Nazaroff (2008) assume hm to be the same as for mass transfer of the substance from the product into air.
Combined, these factors determine the sorption of the substance to surfaces as:

In this equation, Csurf is the concentration of substance in the film on the surface (mass/volume), Vsurf, Ssurf and dsurf are the volume, surface area and thickness of the film, respectively.
Transfer to airborne particulate matter
In analogy with the sorption of substances to surfaces, sorption to airborne particulate matter can be described by partitioning between air and the organic matter content of airborne particles (Weschler and Nazaroff 2008). The particle/air partition coefficient Kpart is then proportional to the Koa, i.e.

where fom,part is the fraction of organic matter in the particles.
Sorption of SVOCs to airborne particles is usually fast compared to the other transfer processes considered. (Little et al. 2012) assume instantaneous equilibration between the gas phase SVOC concentration and the concentration in airborne particles. The concentration of SVOC bound to airborne particles Cap is then given by

Cap is the concentration of the substance (mass/volume) in the particles themselves. If equilibrium between air and particle concentrations cannot be regarded as established instantaneously, the dynamic exchange between material in the gas phase and airborne particles is described by the mass transfer coefficient for airborne particles hmp. The rate of change in the concentration of particle-bound substance is given by

where Sap is the total surface area of the airborne particulate matter and Vap is their total volume.
From the concentration of substance in airborne particles (Cap), the concentration of particle-bound substance in air Cair,p, is derived as:

where TSP (total suspended particles) is the air concentration of airborne particulate matter (mass/volume) and ρap is the mass density of the airborne particulate matter.
Gas phase air concentration
The gas phase concentration of the substance is the result of competing processes of emission, exchange between dust, surfaces and airborne particles and removal by ventilation. The latter is modelled using the ventilation rate q (air changes per time) as
The total rate of change of the indoor air concentration follows from combining equations 2), 5), 6), 8) and, 10):
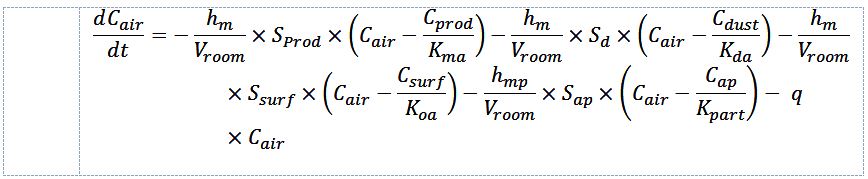
Taken together, equations 2), 5), 6), 8), and 10) define a system of coupled differential equations. Integration of this system of equations using suitable boundary and initial conditions (i.e. reflecting the specific exposure scenario), gives the concentrations of substance in all different compartments (air, product, dust, airborne particles, indoor surfaces) as a function of time. In the DustEx tool, it is assumed that emission starts at t=0, when the product is brought into the indoor environment. It is further assumed that no other sources of emission of the substance are present.
Models for exposure evaluationInhalation
One of the routes of exposure to the substance, emitted from the product to the air, is inhalation. The total air concentration is the sum of the concentration of the substance in the gas phase (Cair) and the air concentration of the substance bound to airborne particles (Cair,p). From the total air concentration the daily-inhaled amount Ainh is estimated as

where Qinh is the inhalation rate (per hour) of the exposed person, fabs,inhal is the fraction of the inhaled amount which is absorbed, and Texp is the daily exposure duration (hours per day). In this equation the concentrations Cair and Cair,p are assumed to be essentially constant over the day of exposure, which is reasonable for SVOCs.
Dermal exposure from air
A second route of exposure to the substance from air is the dermal exposure from the air. Weschler and Nazaroff (2012) propose a method to estimate the dermal uptake from substances in the gas phase of indoor air. Following this approach, the amount absorbed through the skin, Adermal is estimated from the transdermal flux J (mass/surface area/time) as

Here, Sskin is the surface area of the exposed skin.
The transdermal flux is estimated using
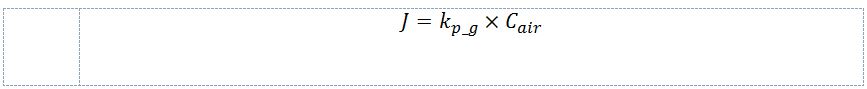
Where kp_g is the trans-dermal skin permeability of the substance that describes mass transfer from the bulk indoor air into the epidermal capillaries.
Estimating kp_g
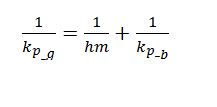
In absence of measured values of the kp_g , the DustEx tool provides a method to estimate it from basic substance properties. This method is described in detail in (Weschler and Nazaroff, 2012). The method assumes that the kp_g is determined by the mass transfer of the substance from air to the skin, hm and the permeability of the skin for a substance from air kp_b , which together act as a system of resistances in series.
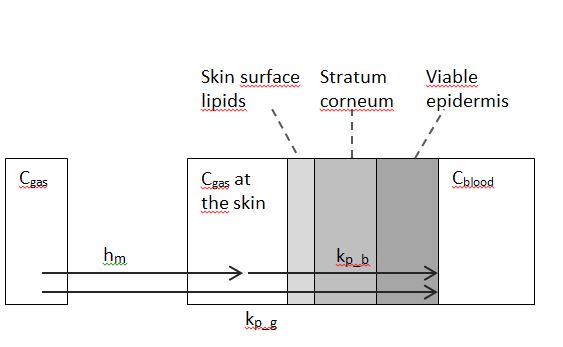
The trans-dermal skin permeability kp_g is modelled as a system of two transfer coefficients in series: the mass transfer coefficient of the susbtance from air to skin hm and the permeability of the stratum corneum/epidermis composite kp_b.
kp_b describes the permeability of the the stratum corneum/epidermis composite.
It is modelled as:
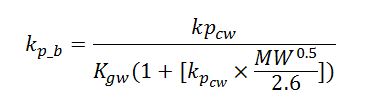
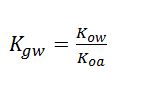
Here, Kgw is the gas-water partition coefficient of the substance. It follows from the molecular properties Kow and Koa as:
kpcw is the permeability of the stratum corneum for a substance dissolved in water. DustEx models the kpcw using the model by (Mitragotri, 2002):

This equation takes the molecular weight in g/mol and predicts a kpcw in cm/s.
Finally, the total transdermal permeability coefficient kp_g is determined by approaching the skin-air system as two resistors in series, with a resistance of hm and Kp_b respectively
Ingestion of house dust
Exposure to substances contained in house dust is assumed to arise from the ingestion of dust. The daily intake of a substance with dust Adust is determined by

Where Adust_ingest is the amount of dust daily ingested and a fraction fabs,oral is actually absorbed.
In the DustEx model dermal exposure to house dust is assumed to be negligible.
Working with the DustEx web application
To use the DustEx model for exposure calculations, input is required for different aspects of the exposure simulation. These aspects include :
- The indoor environment (residence)
- The product/emission
- Dust properties
- Substance properties
- Properties of indoor surfaces/sinks
- Airborne particulate matter properties
- Properties of the exposed population
- Simulation parameters for exposure (duration, frequency, and absorption)
For the simulation parameters, input values need to be entered into the DustEx web application. In practice, data for many of these parameters is scarce.
To assist in performing exposure assessments with the DustEx model a compilation of available information for the most critical simulation parameters is made. Based on this information, for a number of generic parameters (i.e. parameters that do not depend on the substance and product for which the assessment is conducted) defaults are suggested in the web application. The default values are chosen in such a way that they tend to lead to a conservative estimate of exposure. Information and suggested input can be accessed online using the ? buttons next to the parameter input fields in the DustEx web application.
For a number of parameters, the input can be entered to the model as a distribution, using the ^ buttons next to the parameter input fields. In this way an uncertainty analysis of the exposure assessment can be performed. A brief discussion on how uncertainty analysis of the exposure assessment can be conducted can be found here.
Simulation duration
The period over which emission, transfer and exposure are calculated. Starts with the introduction of the product in the indoor environment and ends when the exposure stops. Typically SVOC emission and distribution processes are slow and take months or years to reach(quasi-) steady states. Simulation durations should be chosen between 10 and 999 days.
Exposure frequency
The DustEx model calculates concentrations in indoor air compartments air, airborne particles and dust. Exposure is evaluated by combining the simulated concentration data with the presence of a person in the environment. This presence is specified by the exposure frequency: the number of times a person enters the indoor environment starting with the ‘start of exposure’. Exposure is assumed to take place at regular times separated by a constant interval.
Start of exposure
The first time a person enters the indoor environment after introduction of the product.
Exposure duration on day of exposure
The number of hours a person spends indoors on the day of exposure.
Exposure
Oral absorption fraction
The fraction of the substance that will be absorbed (reaches the blood) via the GI-tract.
Dermal absorption fraction
The fraction of the substance that will be absorbed (reaches the blood) via the skin.
Monte Carlo simulation
The number of iterations should be between 1,000 and 10,000.
Model assumptions and limitationsSemi-volatile substances
The DustEx model models the transfer of a substance from a product or material into different indoor compartments air, airborne particulate matter, surfaces and dust after emission of the substance into air. The model is intended to be used for semi-volatile substances (SVOCs). In the context of DustEx these are defined as substances having a log10 Koa between 7 and 13. For more volatile substances (with a lower Koa) transfer into indoor compartments other than air will be limited. For this reason the lower limit of log10 Koa has been set to 7. For substances with a lower volatility (higher Koa) transfer into the indoor environment will not be via evaporation from the product but rather via other processes such as abrasion and wear of the product. These processes are not included in the model and therefore the Dustex model is not suitable to use for substances with log10 Koa higher than 13.
Long exposure periods
Emission and transfer processes of SVOCs indoors are slow. Typically, for continuously emitting sources, steady state concentrations are reached after periods of weeks to months or even longer. For this reason, the DustEx model focuses on calculating concentration profiles and exposures over longer periods. The duration of exposure simulations in DustEx are therefore limited to be between 10 days and 999 days.
Air as transfer medium
The DustEx model includes a number of emission and transport processes.
Most importantly, air is assumed to be the transfer medium of the substance between different indoor compartments. There are indications that airborne particles may act as a transport medium as well. The presence of airborne particles may increase the mass transfer of the substance from a product into air by as much as a factor of 5 (Benning et al., 2013). Furthermore, dust deposition and resuspension is a process that allows additional exchange between the airborne particle and dust compartments. The processes of dust and airborne particles as transport medium are not included in the model. The impact of this limitation is expected to be mainly on the mass transfer of the substance from the product into air. To remedy this limitation, the mass transfer coefficient could be adjusted to higher values.
Clothing
Dermal absorption of the substance from air is modelled, assuming transfer of the substance from indoor air in gaseous phase across the system of the stratum corneum and the epidermis. The effect of clothing is not included in the model. The role of clothing is subject of ongoing research. The first indications are that clothing provides limited protection from SVOC exposure, and may under circumstances even lead to increased dermal absorption (Morrison et al., 2016). In view of this, the DustEx assumption that wearing of clothing will not reduce dermal absorption from air, seems reasonable.
Overall
In general there will be significant uncertainties in both the model’s accuracy and in the data availability for input parameters. In practical applications of the DustEx model, it is advised to accompany the exposure assessment with an analysis of the uncertainty in the assessment.
Uncertainty analysisIn practice, for many of the input parameters of the DustEx model only limited information will be available. As a consequence, exposure assessments with the DustEx model will contain uncertainty. As a matter of good practice, an exposure assessment should be accompanied with an assessment of uncertainty. Uncertainty assessments can be conducted using various methods with varying degrees of sophistication. The DustEx model supports one specific method, that of probabilistic evaluation (one dimensional Monte Carlo simulation) to quantitatively assess uncertainty.
Probabilistic uncertainty assessment
DustEx facilitates probabilistic uncertainty assessment by 1-dimensional Monte Carlo analysis (‘1D MCA’). In 1D MCA the assessor specifies the value of an input parameter as a probability distribution, reflecting that the true value of the parameter is not known, but that it may take on a range of values with different probability. The 1D MCA consists in repeatedly sampling random values from the input distributions and calculating daily average doses for each sample. This results in a distribution of the calculated daily dose, representing the uncertainty in the calculated exposure as a result of uncertainty in the input values.
Distributions of parameter values are specified by pressing the Distributions button ^ . This opens the Distribution editor, where a distribution type can be chosen (none, uniform, , normal, log–normal or triangular) and parameters to define the distribution can be specified.
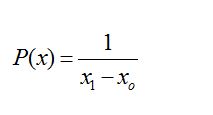
Uniform
Specify a lower bound xo and an upper bound x1 of the distribution. The probability density is defined as:
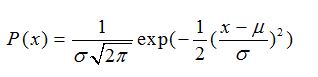
Normal
Specify the mean and standard deviation. The distribution is defined by the probability density function:
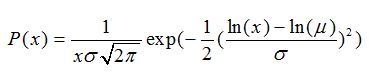
Log-normal
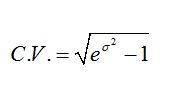
Specify the median and arithmetic coefficient of variation C.V. The probability density is defined as:
and
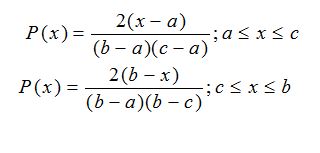
Triangular
Specify (a) location (minimum), (b) scale (maximum) and (c) shape (maximal probability). The probability density varies between the minimum and maximum values and has maximum probability at the ‘shape’. It is defined as:
Running a simulation requires two steps:
- specifying the input parameters for the model in the ‘Input’ section of the web application
- pressing the ‘Simulate’ button and studying the ‘Results’ section
After running the simulation, DustEx presents different output results, depending on the type of exposure calculation.
Specifying model input
Deterministic input
Deterministic input values are specified by entering the values in the parameter edits for each parameter. Some parameters have limits on the validity of their inputs. Entering a value outside the range of validity of the parameter will result in an error message when trying to simulate the scenario.
Scenario settings
In addition to specifying the inputs of model parameters, the user must specify details on the scenario that is simulated. These are found in the section ‘Simulation’.
Settings include:
- Simulation duration, the number of days the scenario is to be simulated (between 10 and 999)
- Exposure frequency. The frequency with which an exposed person is assumed to enter the residence where the product is introduced (maximum 365 per year)
- Start of Exposure. This parameter can be used to simulate a person entering a number of days after instalment of the product
- Exposure duration on the day of exposure. The number of hours a person is assumed to be exposed on every day he enters the residence
Probabilistic input
Most parameters can be given a probability distribution as an input rather than a deterministic value. This can be done by pressing ^ Distributions button next to the parameter. This will unfold the distribution editor, that can be filled in to specify a distribution. A description of the probability distributions that are supported is given in the section on probabilistic simulations [link to undertainty assessment].
When at least one parameter is specified as a distribution, DustEx will conduct a probabilistic simulation. In this case, an extra input section ‘Monte Carlo simulation’ becomes available. Here the assessor can specify the number of samples that is drawn in the Monte Carlo simulation. This number must be between 1000 and 10 000.
In sampling from an input distribution, the DustEx Web application will consider the validity range of the input parameter. If a value outside of the validity range is sampled, the sample is rejected and a new sample is drawn.
When the user wants to go back to a deterministic calculation, the individually selected distributions have to be set to ‘none’.
Results
The DustEx web application will show the following exposure measures as output:
Events doses and time plots
A table gives the events doses:
- Daily average absorbed amounts
- Daily average absorbed doses
These are the amounts absorbed on each day of exposure averaged over the entire exposure duration (daily average absorbed amount) and this value divided by the body weight (daily average dose) respectively. Daily average absorbed amounts and doses are given for each of the pathways inhalation gas phase, inhalation with airborne particles, dermal absorption and ingestion with dust. Also the total daily average absorbed amounts and doses summed over all pathways is given.
For a deterministic evaluation, time plots of concentrations in the different compartments and absorbed amounts or doses are presented over the entire exposure duration. The latter are presented in a stacked plot, so that relative contributions can easily be seen.
Distributions
If a probabilistic evaluation is performed, the application calculates distributions of the average daily absorbed amounts and average daily dose. This is done for each of the pathways inhalation of gas phase substance, inhalation of particle bound substance, dermal absorption and ingestion with dust, as well as for the total exposure. Summaries of the calculated distributions are tabulated. These present median, 95th and 99th percentiles of the distributions.
In addition, a cumulative plot of the distribution of the exposure per pathway is plotted.
A cumulative plot plots exposure on the x-axis and the fraction of the population that has exposure below that exposure level on the y-axis. A cumulative plot allows one to read off directly any percentile of the exposure distribution.
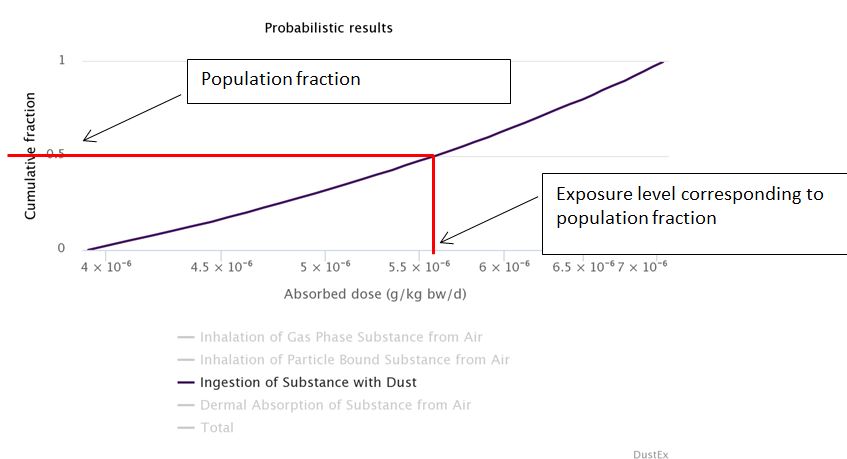
Cumulative plot of the distribution of dose due to dust ingestion in the population. Any percentile of the dose distribution in the population can be read-off from the point in the graph for which the y-value corresponds to the required proportion of the population, as the x-value of this point gives the corresponding dose level.
Exporting an printing results
Graphs can be exported or printed by clicking on the ‘menu- bars’ ( the
Allott RW, Kelly M, Hewitt CN. 1993. A model of environmental behaviour of contaminated dust and its application to dust fluxes and residence times. Atm. Env. 4: 679–687.
Batterman SA, Chernyak S, Jia C, Godwin C, Charles S. 2009. Concentrations and emissions of polybrominated diphenyl ethers from U.S. houses and garages. Environ. Sci. Technol. 43(8): 2693–2700.
Benning, J.L., Liu, Z., Tiwari, A., Little, J.C., Marr, L.C., 2013. Characterizing gas-particle interactions of phthalate plasticizer emitted from vinyl flooring. Environ. Sci. Technol. 47: 2696–2703.
te Biesebeek JD, Nijkamp MN, Bokkers BHG. Wijnhoven SWP. 2014. General Fact Sheet. General default parameters for estimating consumer exposure - Updated version 2014. RIVM Report 090013003/2014.
Bremmer HJ, van Veen MP. 2002. Children’s toys fact sheet. To assess the risks for the consumer. RIVM report 612810012/2002.
Delmaar JE. 2010. Emission of chemical substances from solid matrices. A method for consumer exposure assessment. RIVM Report 320104011.
Ionas AC, Ulevicus J, Gómez AB, Brandsma SH, Leonards PEG, van de Bor M, Covaci A. 2016. Children's exposure to polybrominated diphenyl ethers (PBDEs) through mouthing toys. Environ. Internat. 87: 101–107.
Layton DW, Beamer PI. 2009. Migration of contaminated soil and airborne particulates to indoor dust. Supporting information. Environ. Sci. Technol. 43: 8199–8205.
Little JC, Weschler CJ, Nazaroff WW, Liu Z, Cohen Hubal EA. 2012. Rapid methods to estimate potential exposure to semi-volatile organic compounds in the indoor environment. Environ. Sci. Technol. 46(20): 11171–11178.
Mitragotri, S., 2002. A theoretical analysis of permeation of small hydrophobic solutes across the stratum corneum based on scaled particle theory. J. Pharm. Sci. 91: 744–752.
Morrison GC, Weschler CJ, Bekö G, Koch HM, Salthammer T, Schripp T, et al. 2016. Role of clothing in both accelerating and impeding dermal absorption of airborne SVOCs. JESEE 26(1): 113-118.
Qian J, Ferro AR, Fowler KR. 2008. Estimating the resuspension rate and residence time of indoor particles. J. Air Waste Manage. Assoc. 58(4): 502–516.
Salthammer T, Uhde E. 2009. Organic indoor air pollutants. occurance, measurement, evaluation. Second edition. Wiley: Weinheim. ISBN: 978-3-527-31267-2.
Sukiene V, Gerecke AC, Park YM, Zennegg M, Bakker MI, Delmaar JE, Hungerbühler K, von Goetz N. 2016. Tracking SVOCs’ transfer from products to indoor air and settled dust with deuterium-labeled substances. Env. Sci. Technol. 50(8): 4296-4303.
US EPA, 2015. AMEM-ADL Polymer Migration Estimation Model Download and Install Instructions, http://www.epa.gov/tsca-screening-tools/amem-adl-polymer-migration-esti…, accessed on 22.02.2016.
Weschler CJ, Nazaroff WW. 2008. Semivolatile organic compounds in indoor environments. Atmos. Environ. 42 (40): 9018–9040.
Weschler CJ and Nazaroff WW. 2010. SVOC partitioning between the gas phase and settled dust indoors. Atmospheric Environ. 44: 3609-3620.
Weschler CJ, Nazaroff WW. 2012. SVOC exposure indoors: fresh look at dermal pathways. Indoor Air. 22: 356–377.
Won, D., Sander, D. M., Shaw, C. Y., & Corsi, R. L. (2001). Validation of the surface sink model for sorptive interactions between VOCs and indoor materials. Atmospheric Environment, 35(26), 4479-4488).
www.r-project.org/about.html; accessed 6/7/2016
Xu Y, Little J. 2006. Predicting emissions of SVOCs from polymeric materials and their interaction with airborne particles. Environ. Sci. Technol. 40 : 456–461.
Xu Y, Cohen Hubal EA, Clausen PA, Little JC. 2009. Predicting residential exposure to phthalate plasticizer emitted from vinyl flooring: A mechanistic analysis. Environ. Sci. Technol. 44: 2374-2380.