
As of 1 June, anyone in the Netherlands with (mild) symptoms can be tested for COVID-19 in the GGD test lanes. The percentage of positive tests is low, declining from 2 % in week 23 to 0.9 % in week 26. Since 1 June, hairdressers, driving schools and other contact professions have been allowed to resume their work. So far, one per cent of the people with a contact profession who got tested confirmed positive for COVID-19.
Total number of tests in test lanes
Between 1 June and 29 June, 10:00 am, 230,445 tests were carried out at the GGD test lanes. These tests were for people who contacted the GGD themselves, because they had (mild) symptoms, and also for people who were approached by the GGD for source and contact tracing because they were a contact of a patient with COVID-19. The results of 224,049 of the tests taken are known, 1.2% (2,726) of the tests were positive. The percentage of positive results has been decreasing since 1 June: in week 23, 2% of the tests were positive for the novel coronavirus. In week 26 this was 0.9%. The number of tests carried out per week at the GGD test sites is not decreasing (Figure 1). Figure 2 shows that in the past 14 days the percentage of positive tests was below 2% in all GGD regions.
Contact professions
Since 1 June, 17,859 tests have been administered to people who have contact with people within 1.5 metres (contact professions) during their work. These are, for example, hairdressers, beauticians or driving school owners. The results are known for 17,285 of the administered tests. Of these tests (171), 1% proved positive for the coronavirus.
Source and contact tracing
Of all 2,726 positive tests taken since 1 June at the GGD test sites, 423 had been taken as part of a source and contact study by GGDs (15.5%). These are people who have had contact with patients and have been approached by the GGD. Within the framework of source and contact tracing, a total of 3,147 people were tested for COVID-19. The remaining 2,303 positive tests were taken from people who reported themselves with complaints fitting COVID-19.
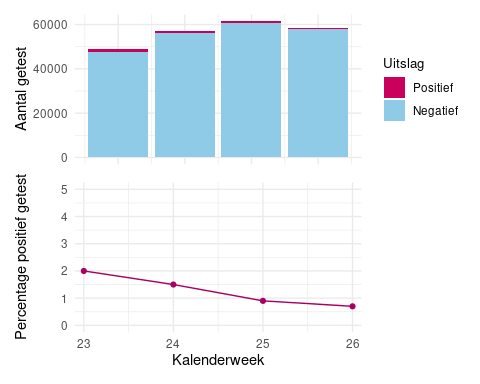
Figure 1. Percentage of the number of tests taken at the GGD test lanes with a positive result, per calendar week (left) and the total number of tests with known results per calendar week (right). (source: CoronIT)
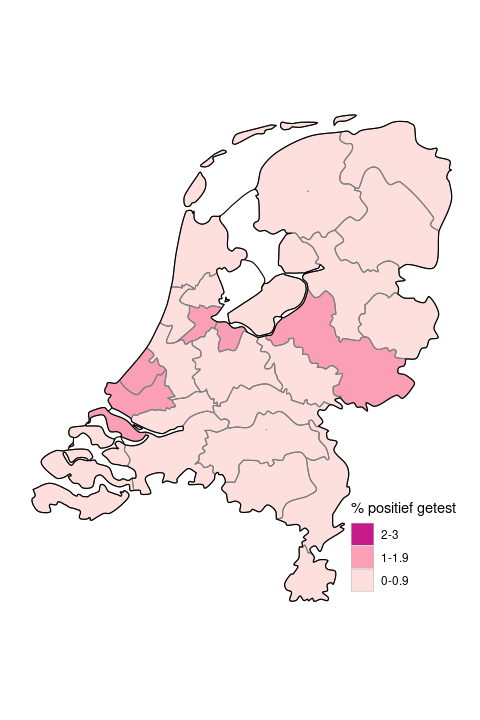
Figure 2. Percentage of positive tests at the GGD test lanes, per GGD region, in the past 14 days. (source: CoronIT)