4,036 new COVID-19 infections were reported over the past week. That is 1,448 more confirmed cases reported than the week before that, when 2,588 new COVID-19 infections were reported, an increase of 56%.
There are major regional differences in the number of confirmed cases. (see figure 1) Like last week, the highest number of confirmed cases was reported in the province of South Holland, followed by North Holland and North Brabant. Within North Brabant, most of the confirmed cases were reported in the west of this province. Per number of inhabitants, the number of confirmed cases reported in Utrecht has also increased (see epidemiological report - only in Dutch)
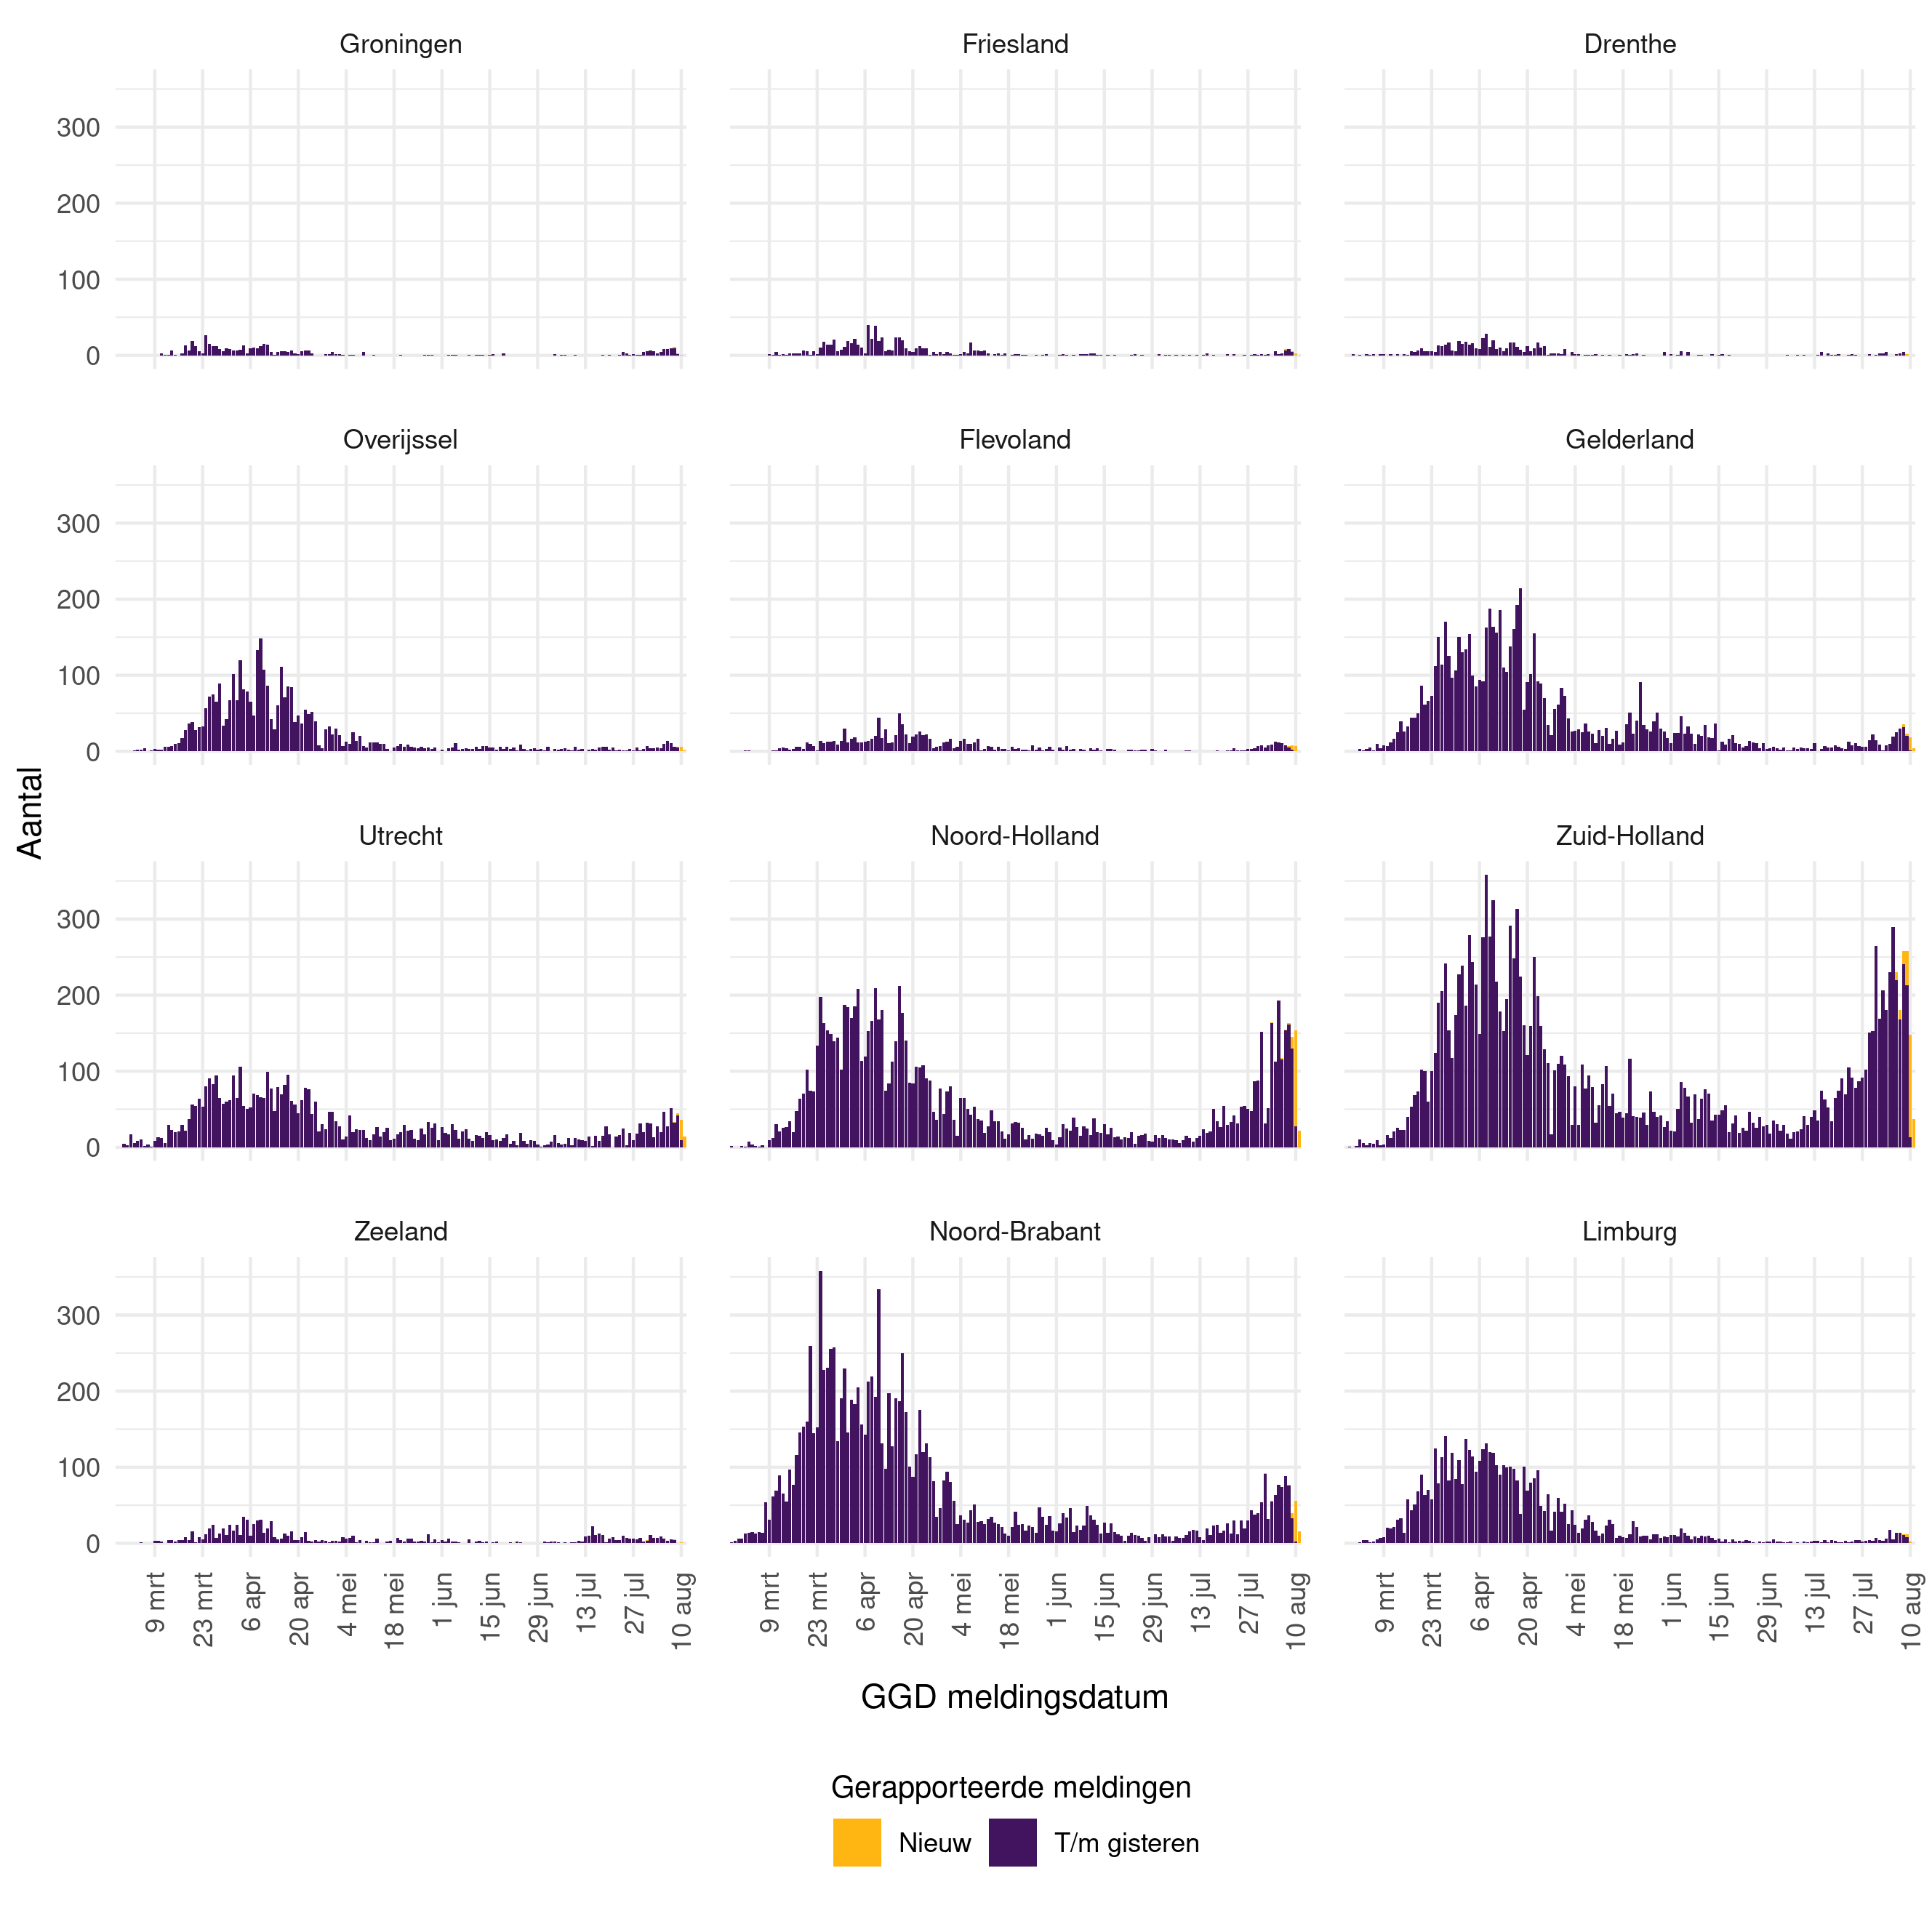
Figure 1: Number of people with COVID-19 reported to the GGDs per week, per province, since 9 March 2020
Hospital admissions and deaths due to COVID-19
Hospital admissions (current or previous) due to COVID-19 were reported during the past week for 38 patients. That is 6 fewer than last week.
9 deaths of laboratory-confirmed COVID-19 patients were reported, 3 more than the week before.
Percentage of positive tests continued to increase in the past week, slightly fewer people tested
Between 3 and 9 August, the number of people tested at the GGD test sites was just under 100,000*, a decrease of nearly 3,000 people tested compared to the previous week. Of the people who were tested last week and whose test results are now known, 3.6% tested positive for COVID-19. That percentage was 2.3% in the week of 27 July. The percentage of positive tests was higher than last week in almost all regions. The highest percentage of positive tests (6%-9%) was seen in the GGD regions of Rotterdam-Rijnmond, Amsterdam, West-Brabant, and Haaglanden. These are also the regions where most of the known clusters are located.
One-quarter of the people who tested positive are in the age group of 20-29 years old. After that, the highest number of people who tested positive during the past week are in the age group of 30-39 years old.
However, half of the people who tested positive and have been hospitalised are 60 years or older.
*Source: GGD-GHOR
Data correction for reports received later
For technical reasons, RIVM did not receive a number of COVID-19 reports on time in the period from 14 July to 10 August. These confirmed cases were known to the relevant municipal public health services (GGDs). In the period from 14 July to 3 August, these delayed reports concerned 34 confirmed cases, no hospital admissions and no deaths. In the period from 3 to 10 August, the delayed reports concerned 121 confirmed cases, 2 hospital admissions and no deaths. The data was corrected today to include these later reports and updates.
Reproduction number R
The reproduction number (R) indicates how many other people are infected on average by one person who has the novel coronavirus. The reproduction number is 1.30. This means that 100 people who are infected with the novel coronavirus will collectively infect another 130 people.
Although the number is higher than the 1.30 reported last week, the bandwidth has hardly changed. The confidence interval is still entirely above 1.
379 COVID-19 infection clusters
There are currently 379 known active COVID-19 clusters in the Netherlands. This represents an increase of 137 clusters of three or more related infections compared to the previous week. Over the past week, the average size of these clusters was 5.5 people (range: 3-43). The GGD is using source and contract tracing to try to identify where each infected person contracted the novel coronavirus. Most clusters have been reported within the home.
Source and contact tracing
Due to the increasing number of confirmed COVID-19 cases being reported, some GGD regions that are receiving many reports are no longer individually entering all contacts in the registration system. As a result, there is no longer a comprehensive overview of contact tracing in the Netherlands during the past week. For that reason, the complete data on source and contact tracing from last week will not be reported in the epidemiological report.
The results of source and contact tracing are now available up to week 31 (27 July to 3 August). Among the close contacts identified in that 14-day monitoring period, 598 COVID-19 infections were identified (9.5% of all close contacts). The percentage of contacts that were infected varied between household members and other close contacts. In the monitoring period from 27 July to 3 August, 15.4% of the household members turned out to be infected with the novel coronavirus. 5.8% of the other close contacts were infected.
Infection and travel history
Since 1 July, the international travel history of people who tested positive for COVID-19 has been requested. In the past week, 405 persons who tested positive for COVID-19 had been in a different country in the 14 days before the start of the confirmed infection. The highest number of people who tested positive and had a travel history had been to France: 22%. This is followed by travellers to Spain (16%), Germany (10%), Belgium (9%), Turkey (7.4%) and Malta (7.4%). This does not mean that all these people contracted the infection in a different country.
To prevent the virus from continuing to spread, it is important for people to comply with the measures: Keep your distance, and stay home and get tested if you have symptoms. Wash your hands, sneeze and cough into your elbow, and use paper tissues.