RIVM has measured tar, nicotine and carbon monoxide (TNCO) levels for 100 brands of cigarettes on the Dutch market using the Canadian Intense (CI) method. These levels have been compared with the TNCO levels declared by manufacturers and measured by them using the ISO method. According to RIVM, the CI method provides a better approximation of what a smoker actually inhales.
The TNCO levels measured by the CI method are at least twice as high for all 100 brands as the levels stated by manufacturers, measured by the ISO method. For some cigarettes, the levels are more than 20 times higher. The biggest difference between the two measurement methods can be seen in cigarettes with relatively low TNCO levels in the ISO method. These low ISO TNCO levels are mainly caused by a high degree of filter ventilation. Because the CI method blocks the filter holes, the degree of filter ventilation does not affect the measurement results. As a result, the differences in TNCO levels between cigarette brands are smaller.
Read more information about the differences between the measurement methods here.
Legal standard
The current law stipulates that cigarette smoke may contain a maximum of 10 mg tar, 1 mg nicotine and 10 mg carbon monoxide, measured according to the ISO method. The ISO TNCO levels fall within those maximum levels and therefore comply with the law. The CI measured TNCO levels are (almost) all higher than this. This is shown in the graphs.
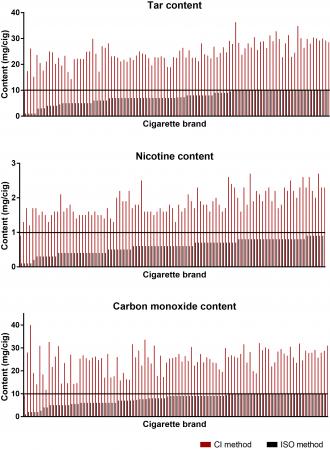
Figure. Tar, nicotin and carbon monoxide levels as measured with the CI and the ISO method. Each bar shows the content of one brand; measured with CI in red and ISO in black. The horizontal line shows the legal maximum for the ISO method.
Results per brand
The TNCO levels of 100 cigarette brands that are available on the Dutch market are included in a table. The left three columns show the levels measured by RIVM using the CI method. The three middle columns show the TNCO levels declared by manufacturers and measured by them using the legally required ISO method. The ratios in the right three columns show how much higher the CI method's TNCO levels are, compared to the ISO method. The columns for tar are shown in blue, those for nicotine are shown in green, and those for carbon monoxide in orange.
View the measurement results table ordered by ratio for tar content here.
View the measurement results table ordered from A-Z here.