RIVM and the Netherlands Institute for Health Services Research (Nivel) are jointly researching how people in the Netherlands perceive the coronavirus crisis and how they are responding to it. Six repeated online surveys were sent out between 24 February and 17 May 2020 to nearly 3,000 people in the Netherlands. Through these survey questionnaires, RIVM and Nivel are investigating the opinions of people in the Netherlands about reporting on the coronavirus SARS-CoV-2, and about how they perceive the risk that the virus poses to their own health and that of their loved ones. The surveys also include questions about how much confidence people have in the information provided by RIVM and the measures taken by the government. In addition, people are asked whether they are following the government measures to curb the coronavirus and what they think of those measures. The results of this study will give RIVM insight into the communication needs of people in the Netherlands. RIVM will incorporate this information into its communication.
This is an interim report presenting part of the results of four rounds of questions. These survey results were collected in the period from 24 February to 3 May. This will be followed by the results of a final survey that will be sent out in the week of 11 May. For the full results of the first five survey rounds, please see the following fact sheets: fact sheet 24 February – 1 March, fact sheet 16 – 22 March, fact sheet 30 March – 5 April, fact sheet 13 – 19 April and fact sheet 28 April – 3 May.
People participating in the study
The survey questionnaires are sent to members of the Nivel Consumer Panel on Health Care. The survey sent out in 24 February – 1 March was completed by 3,114 people; the survey in 16 – 22 March by 2,592 people; the survey in 30 March – 5 April by 2,710 people; the survey in 13 – 19 April by 2,726 people; and the survey in 28 April – 3 May by 2654 people. The gender distribution of participants in the first survey was 53% men and 47% women. The average age of the participants was 65 years old. This average age is higher than the average age in the Netherlands. This is because relatively few people under the age of 30 take part in the Nivel Consumer Panel on Health Care.
Reporting on the coronavirus SARS-CoV-2
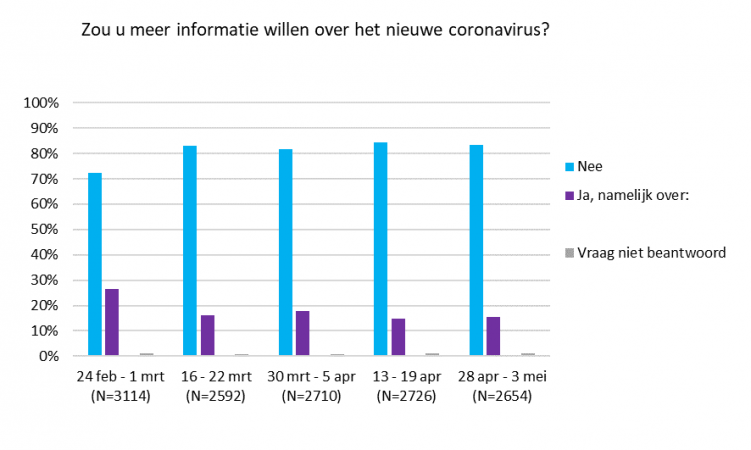
We asked the participants in the study if they would like more information about the novel coronavirus, and if so, about what. In the week of 24 February, 26% of the participants said they needed more information. In the week of 28 April – 3 May, only 15% of the participants still said they needed more information about the coronavirus.
In the week of 24 February 24, the participants mainly wanted more information about how people could become infected with the coronavirus, the best way to protect themselves, and what the symptoms of a coronavirus infection are. In the most recent survey round, in the week of 28 April, participants still often stated that they needed more information about how people could become infected with the coronavirus and how contagious it is. Participants also expressed a need for more information about face masks and about figures on morbidity (illness), mortality (death) and risk of illness due to the coronavirus. Many participants also expressed a need for clear and unambiguous information.
Figure 1. The percentages of responses per survey to the question "Would you like more information on the new coronavirus?" (response options: No / Yes, about...). The ‘N' indicates the number of participants per survey.
Concerns about the novel coronavirus
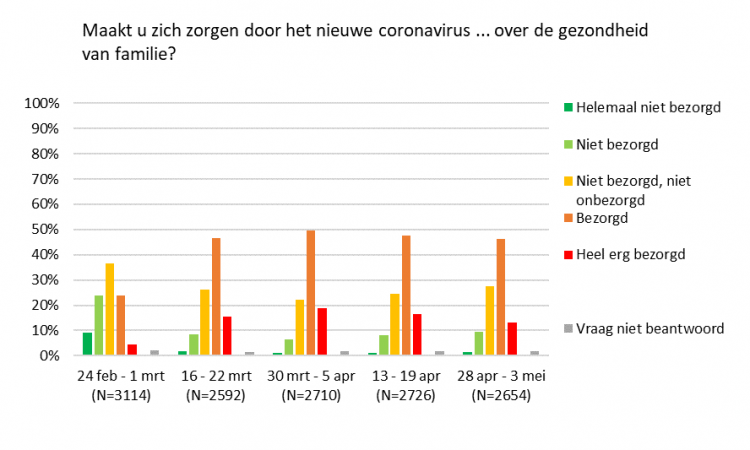
Survey participants were asked how concerned they are about the novel coronavirus. In the week of 24 February, 19% of those surveyed were concerned about their own health and 28% about the health of family members. The percentage of concerned participants was higher each time in the survey rounds that followed. For example, in the week of 30 March, 47% of those surveyed were concerned about their own health and 69% about the health of family members. In the week of 28 April – 3 May, the percentage of concerned participants was lower; 39% of those surveyed were concerned about their own health at that time, while 59% were concerned about the health of family members.
The people who indicated they were concerned were also asked why they were concerned. In the most recent survey round, in the week of 28 April, participants often mentioned that they were worried because they themselves or their loved ones were vulnerable – for example due to advanced age or health problems. In addition, people indicated that they were concerned because of the potentially serious, and unpredictable, course of COVID-19 and because the situation is still very uncertain.
Figure 2. The percentages of responses per survey to the question “Are you concerned about your own health due to the novel coronavirus?”. The ‘N' indicates the number of participants per survey.
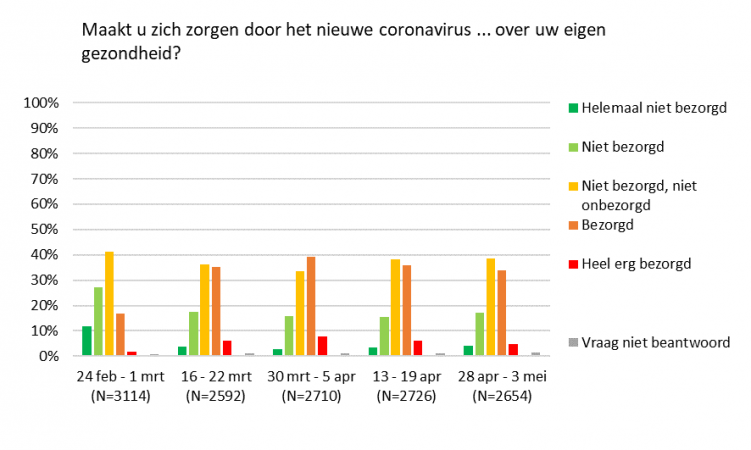
Figure 3. The percentages of responses per survey to the question “Are you concerned about the health of your family members due to the novel coronavirus?”. The ‘N' indicates the number of participants per survey.
Confidence
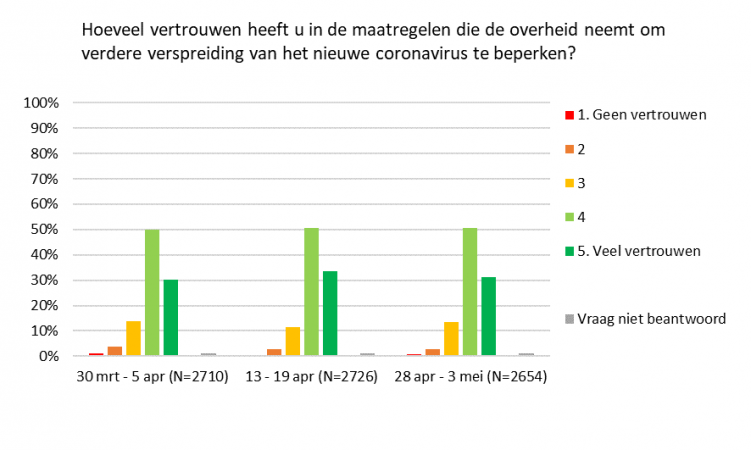
We asked the participants if they had confidence in the information provided by RIVM and the measures taken by the government. These questions were only asked in 30 March – 5 April, 13 – 19 April and 28 April – 3 May. In the week of 30 March, 84% of the participants indicated that they had confidence in the information provided by RIVM, and 80% said they had confidence in the measures taken by the government. These percentages were slightly higher in the week of 13 April: at that time, 85% of the participants indicated that they had confidence in the information provided by RIVM, and 84% said they had confidence in the measures taken by the government. In the week of 28 April, the percentages were slightly lower again: at that time, 83% of the participants indicated that they had confidence in the information provided by RIVM, and 81% had confidence in the measures taken by the government.
Figure 4. The percentages of responses per survey to the question “How much confidence do you have in the information provided by the National Institute for Public Health and the Environment (RIVM) about the novel coronavirus?”. The ‘N' indicates the number of participants per survey.

Figure 5. The percentages of responses per survey to the question “How much confidence do you have in the measures taken by the government to limit the spread of the novel coronavirus?”. The ‘N' indicates the number of participants per survey.
Measures to combat the novel coronavirus
We asked the participants if they were following the government guidelines and what their opinion was of the measures taken by the government to limit the spread of the novel coronavirus. These questions were only asked in 30 March – 5 April and 13 – 19 April.
In the week of 30 March, 93% of those surveyed responded that they were complying with the government guidelines, while 6% responded that they were partly complying with the guidelines. In the week of 13 April, the percentage of participants who said they were complying with the government guidelines was slightly lower at 91%, while 8% indicated at that time that they were partly complying with the guidelines. In the week of 28 April, 87% of the participants responded that they were still complying with the guidelines, while 12% indicated that they were partly complying with the guidelines.
Beyond that, in the week of 30 March, 86% of those surveyed responded that they thought that the measures taken by the government were helping to limit the spread of the novel coronavirus. This percentage was slightly higher in the week of 28 April, rising to 90%. In addition, in the week of 30 March, 86% of the participants responded that most people in their environment were complying with the measures. Fewer people gave that answer in the week of 28 April, down to 79%. In addition, in the week of 30 March, 97% of the participants indicated that they felt that people should be complying with the measures. This percentage remained high in the week of 28 April, at 95%. Finally, in the week of 28 April, 22% of the participants indicated that they were finding it difficult to comply with the measures. That percentage was only 14% in the week of 30 March.
Figure 6. The percentages of responses per survey to the question “Are you complying with the guidelines advised by the government to limit the further spread of the novel coronavirus?”. The ‘N' indicates the number of participants per survey.
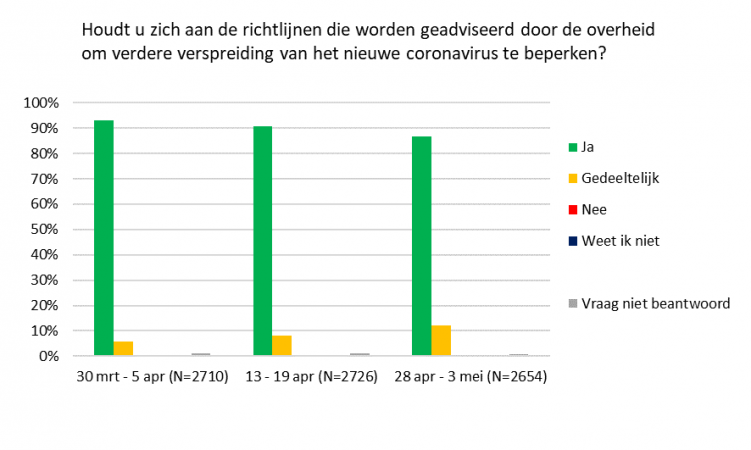
Figure 7. The percentages of responses per survey to the statement “I think that the advised measures help to limit the spread of the novel coronavirus”. The ‘N' indicates the number of participants per survey.

Figure 8. The percentages of responses per survey to the statement “Most people in my immediate environment are complying with the advised measures”. The ‘N' indicates the number of participants per survey.
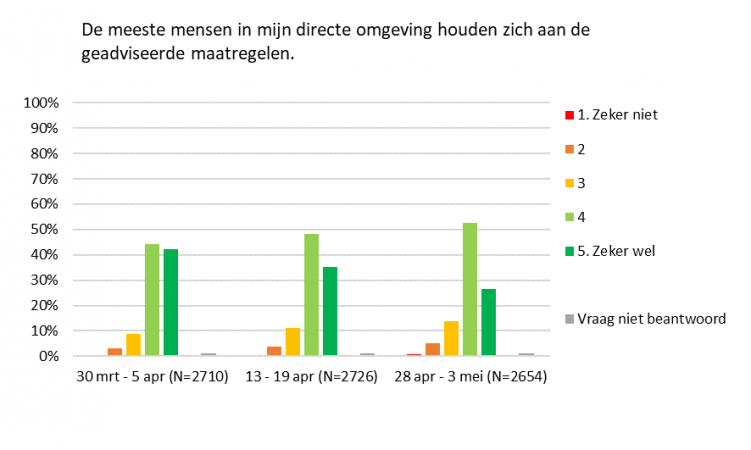
Figure 9. The percentages of responses per survey to the statement “I think that people should comply with the advised measures”. The ‘N' indicates the number of participants per survey.
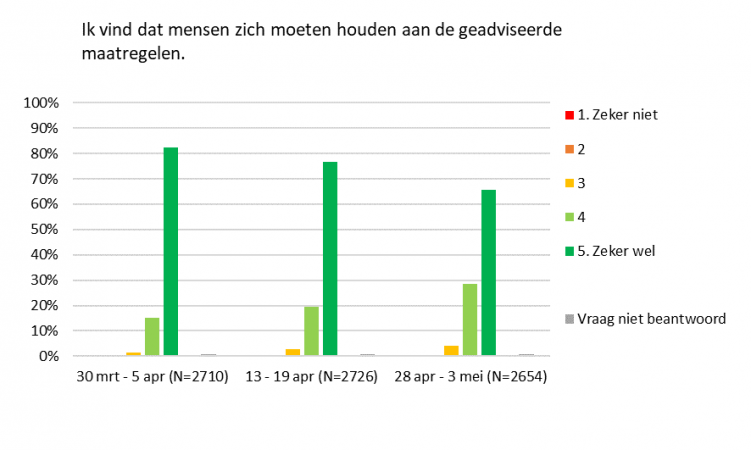
Figure 10. The percentages of responses per survey to the statement “I find it difficult to comply with the advised measures”. The ‘N' indicates the number of participants per survey.

Contact information
If you have questions about this study, please contact Marion de Vries.
Behavioural science study of 90,000 Dutch people
In mid-April, RIVM launched a second in-depth study together with Municipal Public Health Services (GGDs) on behavioural measures and well-being during the epidemic. This study, which runs until the end of June, monitors in more detail how well behavioural measures are being maintained and how this is affecting people. This survey questionnaire alternates with the survey that is reported on this page, sent to approximately 90,000 Dutch people. More information about this behavioural science study can be found here.