In the past week, from 23 to 29 December, the reported number of people who tested positive for COVID-19 was 67,388. This is a slight decrease of 11.7% compared to the week of 16 to 22 December when there were 82,340 newly reported infections*, an estimated 76,300 of which could be attributed to that week. The percentage of positive tests was 13.0% last week. This is a decrease of 0.7% compared to a week earlier, when the percentage of people who tested positive for COVID-19 was 13.7%. The number of people who were tested last week decreased by 14%, down to 438,656.
The security regions of Limburg-Noord, Twente, Gelderland-Midden and Noord-Holland-Noord have the highest number of newly reported infections per capita, with more than 500 reported infections per 100,000 inhabitants. Even so, all security regions show a decrease compared to the previous week. The largest decrease was seen in the security regions of Midden- en West-Brabant, Amsterdam-Amstelland and Utrecht.
Figure 1 shows a minor decrease in the number of reported infections in all age groups last week compared to the week before. The largest decrease in the number of reported infections per 100,000 people was in the age group of 13-17 years.
This decrease may be an initial effect of the lockdown that started on 15 December. However, it is also possible that the holidays have had an effect on people’s testing behaviour. If people did not get tested as often if they had symptoms, that could also explain part of the minor decrease in the number of reported infections.
*including the estimated 6,000 reported infections in the week of 9 to 15 December, which were reported in the week of 16 to 22 December due to a malfunction.
Figure 1. Number of reported positive tests per age category per week.
Hospital admissions and ICU admissions
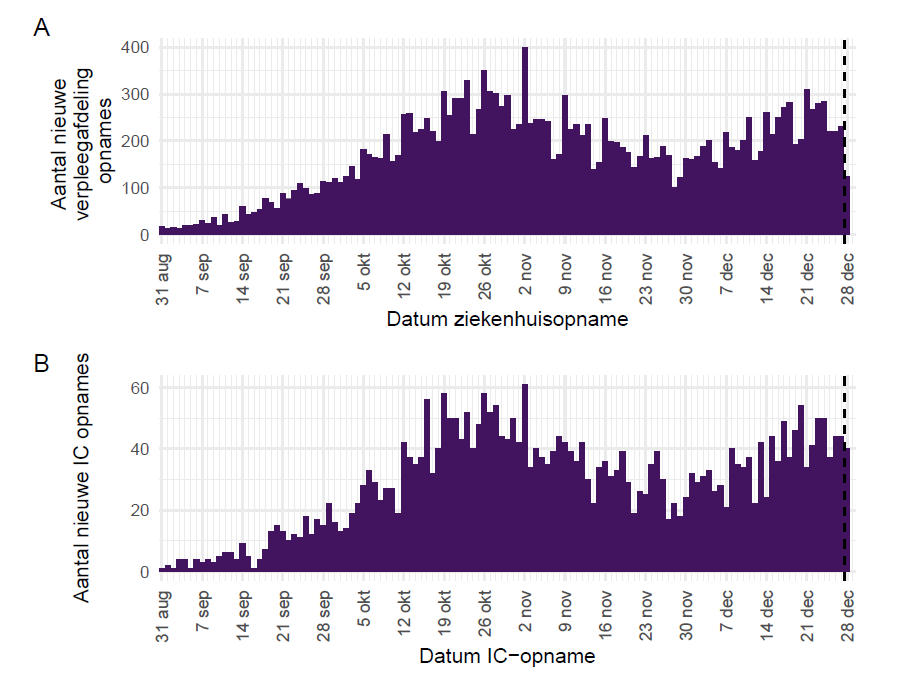
In the week of 21 to 27 December, the number of people admitted to the nursing wards of hospitals with COVID-19 increased somewhat less rapidly than in the week before. 1,811 patients were admitted to hospital, nearly 140 more than in the previous week, when 1,675 people were admitted. The number of people who became so ill that they had to be transferred to intensive care also increased slightly. In the week of December 21 to 27, there were 300 new ICU admissions. 290 new patients were reported as admitted to ICU in the week before that (Figure 2).
Figure 2. (A) Number of new COVID-19 patients per day in Dutch* nursing wards. (B) Number of COVID-19 patients per day in Dutch* intensive care units. Source: NICE Foundation
*Including admissions to German ICUs when Dutch ICUs were over capacity.
Nursing homes and residential facilities for the disabled
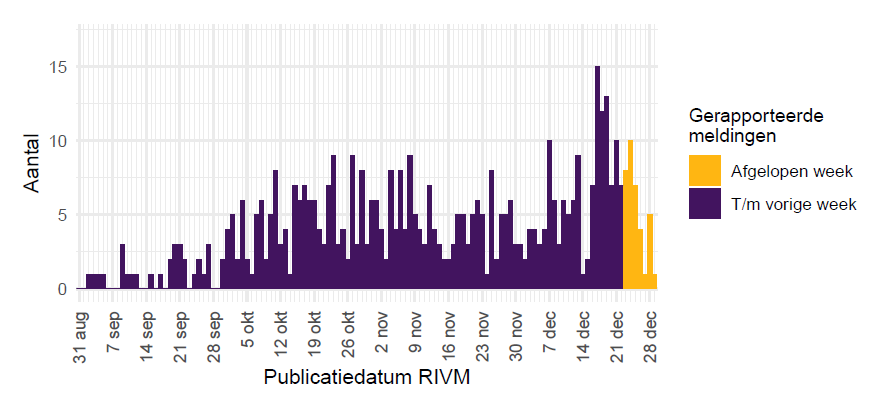
The number of new nursing home locations and residential care centres with at least 1 confirmed COVID-19 infection decreased slightly in the past week, dropping from 197 in the week of 16 to 22 December to 165 in the past week. A decrease was also seen in residential facilities for people with disabilities, from 71 locations in the week of 16 to 22 December to 36 last week.
A nursing home, residential care centre or residential facility for people with disabilities is counted as a ‘new location’ if no new patients have been reported at least 28 days prior to the positive test result (Figures 3 and 4).
Figure 3. Number of new nursing home and residential care centre locations with at least one laboratory-confirmed COVID-19 infection from 31 August 2020 on.
Figure 4. Number of new locations at residential facilities for people with disabilities with at least one laboratory-confirmed COVID-19 infection from 31 August 2020 on.
Reproduction number and number of contagious people
The reproduction number on 11 December, before the start of the lockdown that was implemented on 15 December, decreased slightly compared to the week before, dropping to 1.15 (lower limit 1.12 and upper limit 1.17), based on the number of reports of people with a positive test result. A reproduction number of 1.15 means that 100 people will collectively infect another 115 people with the virus. The reproduction number was 1.25 in the week before that. A reproduction number higher than 1 indicates that the virus is spreading more.
The number of contagious people in the Netherlands has risen. On 17 December, there were nearly 165,000 people in the Netherlands who were contagious for the coronavirus SARS-CoV-2 (lower limit 125,000, upper limit 203,000). This is an increase of 43,000 contagious people compared to the week before that, when there were 122,000 contagious people.
Keep following the measures during New Year’s!
If you have symptoms that could indicate COVID-19, it continues to be necessary to stay home and get tested. To slow the continued spread of the virus, it is important for everyone to comply with the measures and the basic rules. Stay at least 1.5 metres from others. Stay home as much as possible, and minimise the number of people you have contact with. Work from home. If you have symptoms, stay home and get tested. Wash your hands frequently, especially when you arrive somewhere from outside.
Open data
RIVM publishes open data that is accessible to everyone every day around 15.15 hrs (3:15 PM).
**The estimates for R from longer than 14 days ago are reliable. An estimated R based on data from less than 14 days ago involves more uncertainties. That is why we always look at the R from 14 days ago.
**The estimates for the number of contagious people from longer than 7 days ago are reliable. Estimates for the number of contagious people based on data from less than 7 days ago involves more uncertainties. That is why we always look at the number of contagious people from 7 days ago.
| Last week1 | Two weeks ago2 | |
|---|---|---|
| Reports of people with coronavirus SARS-CoV-2 | ||
| Newly reported COVID-19 infections | 67,388 | 82,340 |
| Hospital admissions to nursing wards (Source: NICE)3 | 1,811 | 1,675 |
| Hospital admissions to Intensive Care (Source: NICE)3 | 300 | 290 |
| Deaths | 583 | 472 |
| GGD test lanes per calendar week4 | week 52 | week 51 |
| Total number of tests of which results are known | 409,093 | 479,766 |
| Number of people who tested positive | 53,147 | 65,560 |
| Percentage of positive tests | 13.0% | 13.7% |
Not all of the reported hospital admissions or deaths occurred within the last 24 hours
¹ GGD reports to RIVM between 22 December 10:01 and 29 December 10:00 as published 29 December 2020 in the weekly epidemiological update on SARS-CoV-2 in the Netherlands.
² GGD reports to RIVM between 15 December 10:01 and 22 December 10:00 as published 22 December 2020 in the weekly epidemiological update on SARS-CoV-2 in the Netherlands.
3 As published 29 December 2020 in the weekly epidemiological update on SARS-CoV-2 in the Netherlands. The figures from the past week and current week may be updated to include any registrations provided later by the NICE Foundation.
4 As published 29 December 2020 in the weekly epidemiological update on SARS-CoV-2 in the Netherlands. The figures from the past week and current week may be updated to include any test results provided later.


