
In the week from 2 to 9 March, 31,959 people received a positive test result for COVID-19, about the same as in the week before that. More than 360,000 people were tested, an increase of nearly 14% compared to the week before that. The reproduction number continues to hover around 1. The number of COVID-19 infections in the Netherlands will not decrease until the R number is completely below 1. Infections in nursing homes and residential care centres continued to decrease this week. Vaccination is making an impact in those facilities.
The number of people who were tested for the SARS-CoV-2 coronavirus increased again last week, for the third week in a row (Figure 1). People aged 30 to 39 were tested most frequently last week, followed by people aged 18 to 24. This is a good development. The more people who get tested and stay home if they have COVID-19, the greater the chance that we will be able to contain the virus. The percentage of positive tests decreased from 8.9% a week earlier to 8.1%* in the past week.
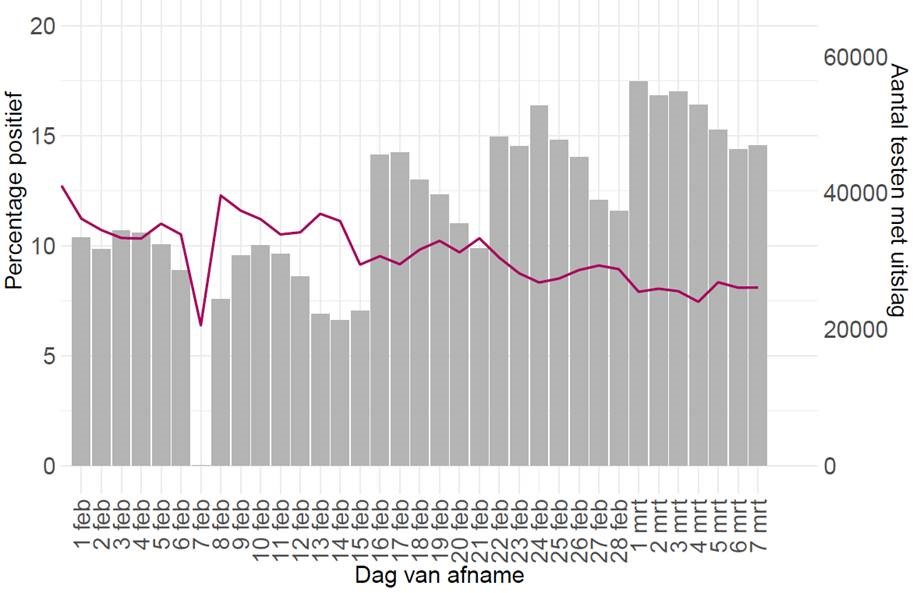
Figure 1: People who were tested in the GGD test lanes, and the percentage of people who tested positive for COVID-19, per day.
The number of newly reported infections per 100,000 inhabitants increased among people under 25 (see Figure 2). The largest increase in the number of positive COVID-19 tests was seen in the age group of 18-24 years. In the other age groups, the number of positive COVID-19 tests was lower than in the previous week. The biggest decrease was seen in the age category of people over 70. The number of newly reported infections in nursing homes also continued to decrease. This indicates that vaccination is having an impact.
Figure 2: Number of reported positive tests per age category per week.
Hospital admissions and ICU admissions
1,145 people with COVID-19 were admitted to hospital in the past week. That is 46 fewer than the week before. 271 people became so ill that they had to be transferred to the Intensive Care Unit (ICU). That is 48 more ICU admissions than the week before. The number of new ICU admissions has been rising for the past four weeks (source: NICE Foundation).
Ages of people admitted to hospital and ICU
In the month of February, 4,823 people were hospitalised due to COVID-19 (Figure 3A). Nearly half (47%) of these patients were aged 60-79 years old, while 24% of the patients were in the 40-59 age group. This is about the same as the age group of 80 years and older. In the 0-39 age group, 256 people (5%) were admitted to the nursing ward.
In February, 828 people were admitted to the ICU due to COVID-19 (Figure 3B). Nearly two-thirds (61%) of these ICU patients were aged 60-79 years old, and nearly one-third (31%) were aged 40-59. A small percentage of patients admitted to the ICU were 0-39 years old (4%) and 80 years and older (4%).

Figure 3: hospitalisations (A) and ICU admissions (B) for COVID-19 by age in February 2021. (source: NICE Foundation)
Reproduction number R
The reproduction number for all variants combined dropped to 0.98 (0.95 – 1.01) on 22 February, see Table 1. A reproduction number of 0.98 means that 100 people with COVID-19 will collectively infect another 98 people. The reproduction number is updated twice a week, on Tuesdays and Fridays, on the Coronavirus Dashboard.
Based on the latest results from pathogen surveillance, nearly two-thirds (64%) of the people who tested positive for COVID-19 in the week of 15 to 21 February had the UK variant. This indicates that almost two-thirds of the new infections in the previous week involved the UK variant. This is slightly later than RIVM predicted in early February. The latest data from pathogen surveillance, including the prevalence of the different variants, can be found here.
Table 1 shows the reproduction number divided into the R number for the UK variant, the South African variant and the old variants. The South African variant is still rare in the Netherlands, so the estimated R number has a high margin of uncertainty.
| 22 February 2021 | 12 February 2021 | |
|---|---|---|
| All infections (combined) | 0,98(0,95 - 1,01) | 0,99 (0,96 - 1,02) |
| UK variant | 1,06 (1,02 - 1,09) | 1,26 (1,20 - 1,33) |
| South African variant | 1,01 (0,83 - 1,20) | 1,37 (1,12 - 1,61) |
| Old variants | 0,82 (0,77 - 0,87) | 1,02 (0,96 - 1,07) |
Table 1. Reproduction numbers in the Netherlands for 22 February and 12 February.
The reproduction number is updated twice a week on the Coronavirus Dashboard. Updates on Tuesdays and Fridays.
Are you considering getting tested? Then get tested
Relaxed measures may lead to more infections as the number of contact moments increases. Follow the COVID-19 rules. Avoid contact with others as much as possible. If you do meet up with someone, stay 1.5 metres apart. Wash your hands frequently, and in any case when you arrive somewhere or come home. Do you have any symptoms? Stay home and get tested. Do you have COVID-19? Then stay home, avoid contact with others, and cooperate with source and contact tracing by the Municipal Public Health Services (GGDs). This is how we can stop the virus from spreading.
* Excluding results from large-scale testing in Bunschoten, Dronten and the Charlois neighbourhood of Rotterdam. If the localised large-scale test results from these locations are included, the percentage of positive tests in the Netherlands is 8.0%; without the large-scale test results, the percentage of positive tests in 8.1%. The percentage of positive tests including large-scale testing is 6.0% in Utrecht (6.0% excluding those results), 5.7% in Flevoland (8.4% excluding), and 9.8% in the Rotterdam-Rijnmond region (10.3% excluding).