RIVM uses scientific models to map the spread of the coronavirus SARS-CoV-2. Using data from research in the Netherlands, RIVM can estimate the course of the outbreak and calculate the effect of measures. RIVM continuously updates these calculations with recent data. More background information about the models and figures is provided below.
Models
RIVM uses models to calculate how quickly an infectious disease spreads among a group of people. A model offers a simplified representation of the actual reality and may be used to investigate the potential impact of measures. It is important to be cautious about drawing conclusions based on models since there are always limiting conditions and relevant factors to consider. This is especially true for new diseases such as the coronavirus SARS-CoV-2, since many aspects related to the virus are still unknown. The more we know about the virus and how it spreads, the better the models will correspond to reality. To account for the unknowns, we base our calculations on many different options. As we gain more knowledge, we can eliminate options that are no longer applicable. The remaining options that we calculate are then more probable.
The most important starting point of the model is that the disease is contagious. For our calculations, we rely on factors such as how contagious the virus is and how it spreads. For example: How long does it take for someone to become contagious? How long is a person actually contagious? How many other people does one person infect?
Open and transparent research
RIVM is conducting research on the coronavirus SARS-CoV-2 that includes the use of models. When the studies are completed, the results are published. RIVM publishes research in international peer-reviewed journals. This leads to open access publications: publications that are accessible to everyone. The codes and data we use will also be publicly available. RIVM shares data and research results with all kinds of organisations in the Netherlands and abroad. Internationally, RIVM exchanges data with the World Health Organisation (WHO) and the European Centre for Disease Prevention and Control (ECDC), and with health institutes in other European countries.
Crisis management and policy recommendations based on models
RIVM identifies outbreaks and threats of infectious diseases and advises on how to control them. On the basis of calculations made by researchers using the models, RIVM provides recommendations on the control measures. Results and insights are shared during technical briefings in the House of Representatives (in Dutch). On those occasions, RIVM also answers parliamentary questions about the models used.
What does RIVM calculate and how?
The reproduction number (R) indicates how fast the virus is spreading. The number represents the average number of people that are infected by someone with COVID-19. A reproduction number of 1 means that 100 people with COVID-19 will collectively infect another 100 people. In that case, the virus is continuing to spread. A reproduction number of 1.39 means that 100 people with COVID-19 will collectively infect another 139 people, which means the virus is spreading rapidly. If R is lower than 1 for an extended period, the virus will stop circulating. R is an important number to see how fast the virus is spreading in the Netherlands, and to determine the intensity of the measures needed to prevent its further spread.
The reproduction number should be kept as low as possible. The reproduction rate may change depending on how much contact people have with others. This factor can be influenced by measures, for example.
To calculate the reproduction number (R), we need to know how the number of COVID-19 cases are increasing over time. That is determined by looking at the numbers of reported COVID-19 cases per day in the Netherlands. We also need to know the time between the first day of illness for the infected person and the first day of illness for the source contact. Based on the data from the Netherlands, we know that the average interval is 4 days. RIVM uses an established method to estimate the reproduction number*.
* If the number of new hospital admissions is low, RIVM calculates the reproduction number (R) based on the number of confirmed COVID-19 cases that are reported. The Municipal Public Health Services (GGDs) keep records on new hospital admissions and newly reported cases.
As a metric for defining disease spread, hospital admission data are always delayed, because it is not yet clear on a person’s first day of illness if that person will be admitted to hospital. Furthermore, reports of hospitalisations are submitted or updated with a delay. We take both forms of delay into account in our models. The estimates for R from before 14 days ago are reliable; an estimated R based on data from less than 14 days ago involves more uncertainties. That is why we do not look at “today’s R”: it is too uncertain to be reliable.
The following data is used to calculate R:
- Data from the National Intensive Care Evaluation (NICE) Foundation. These are figures on the number of hospital admissions in the Netherlands and the number of admissions to intensive care.
- Data from the Municipal Public Health authorities (GGDs). The GGDs enter information about newly reported COVID-19 cases in the OSIRIS system. These details include the number of new patients, their first day of illness, the possible source of infection, and the number of people admitted to hospital. Via OSIRIS, all the data provided can be accessed by RIVM. RIVM manages the system and works to provide access to the data. The published data must comply with privacy laws as set out in the General Data Protection Regulation (GDPR).
The number of people who are tested in any given time period does not affect the reproduction number very much. The reproduction number may be higher or lower for a very short time, but not before or after that, or for an extended time period.
The reproduction number indicates the ratio between the number of infections at two points in time, at intervals of approximately 4 days. If a change in testing produces an equal change in the number of people who tested positive at the two points in time, then the reproduction number remains the same.
We check this calculation by also calculating the reproduction number based on hospital admissions and based on ICU admissions. Hospital admissions and ICU admissions depend on the severity of illness and are not affected by whether many or few people get tested. If we see a change in the R based on reported positive tests that is also reflected in the R based on hospital admissions and ICU admissions, then the change is probably not due to testing behaviour, but rather that the virus is more or less widespread in the Netherlands.
To calculate the reproduction number for a given day, the people who are infected must have been reported based on cases of illness on that day. It takes two weeks from the time that the infections occurred until the confirmed cases are sufficiently complete. The reproduction number is an important data point in order to prepare for different scenarios. This can only be done on the basis of estimates, since we do not have access to future data.
RIVM looked at what the effect would be if the Netherlands opened primary and secondary schools simultaneously or consecutively. The risk of outbreaks in schools was lowest when primary schools opened first, followed by secondary schools. We did this research in collaboration with the London School of Hygiene and Tropical Medicine.
If a person catches the coronavirus SARS-CoV-2, that person is contagious and can infect others for a certain period. How long this takes varies from person to person. Based on various data sources about how many people are infected with the coronavirus in a specific period, it is possible to estimate the number of contagious people in the Netherlands. This estimate involves some degree of uncertainty; the exact number is unknown, but we can calculate the probable range of values. The method is constantly evolving.
Since 8 October 2020, the number of contagious people has been calculated based on hospital admissions by age group and on serological data from the second round of the PIENTER Corona Study. A serological test is used to check whether antibodies against a certain virus are present in the blood. Seroprevalence (the number of people who have detectable antibodies against SARS-CoV-2) per age group provides a good impression of how many people have been infected up to that time. It can be assumed that someone who has an antibody response to SARS-CoV-2 was also contagious at some point. Combined with the total number of hospital admissions up to that moment, it is possible to estimate the number of infected people per hospital admission; this number differs per age group. In this way, recent hospital admissions can be converted into recent infections. Based on information on the incubation period and the reported time between the first days of illness of infected person and source contact, we can assume that an infected person is contagious from two days before the first symptoms until four to eight days after the first symptoms.
Until 8 October 2020, the serological data from the first round of the PIENTER Corona Study was used. Between 12 June and 8 October 2020, the number of contagious people was also based on the number of newly reported infections, because hospital admissions were low at that time. When the number of hospital admissions started rising, this was discontinued.
From 20 March on, RIVM has been providing weekly forecasts for IC occupancy. These projections are based on a distribution model in which the population is divided into groups of the same age, and within these groups further subdivided on the basis of infection status:
- People who are susceptible to infection
- People who are infected with the coronavirus SARS-CoV-2
- People who previously had the coronavirus and are no longer susceptible to infection
In the model used to calculate the possible spread of the virus (the transmission model), the likelihood that two people will have potentially contagious contact depends on their age. To determine this probability, we sent surveys to a randomly selected, representative group of residents in the Netherlands. These people reported their age, and stated the number of different people they had contact with every day. Similar studies were conducted in the Netherlands in 2007, 2017 and 2020. This makes it possible to estimate the number of contacts made within and between age groups. The method used for this is accessible to everyone.
In the model, a person can become infected after contact with another person who is infected with the coronavirus SARS-CoV-2. The probability of becoming infected is defined such that the number of estimated ICU admissions corresponds as closely as possible to the actual number of ICU admissions. The risk of becoming infected may change over time. If a person is infected, their age determines their risk of developing symptoms, their risk of ending up in hospital, and their risk of being admitted to the ICU or dying. If a person is admitted to hospital or ICU, then the duration of their hospitalisation or ICU admission is defined such that it corresponds to the data provided by the National Intensive Care Evaluation (NICE) Foundation. For this purpose, we fit a distribution to the observed admission figures . The NICE admission figures for the last few days are often incomplete. We correct for the reporting delay.
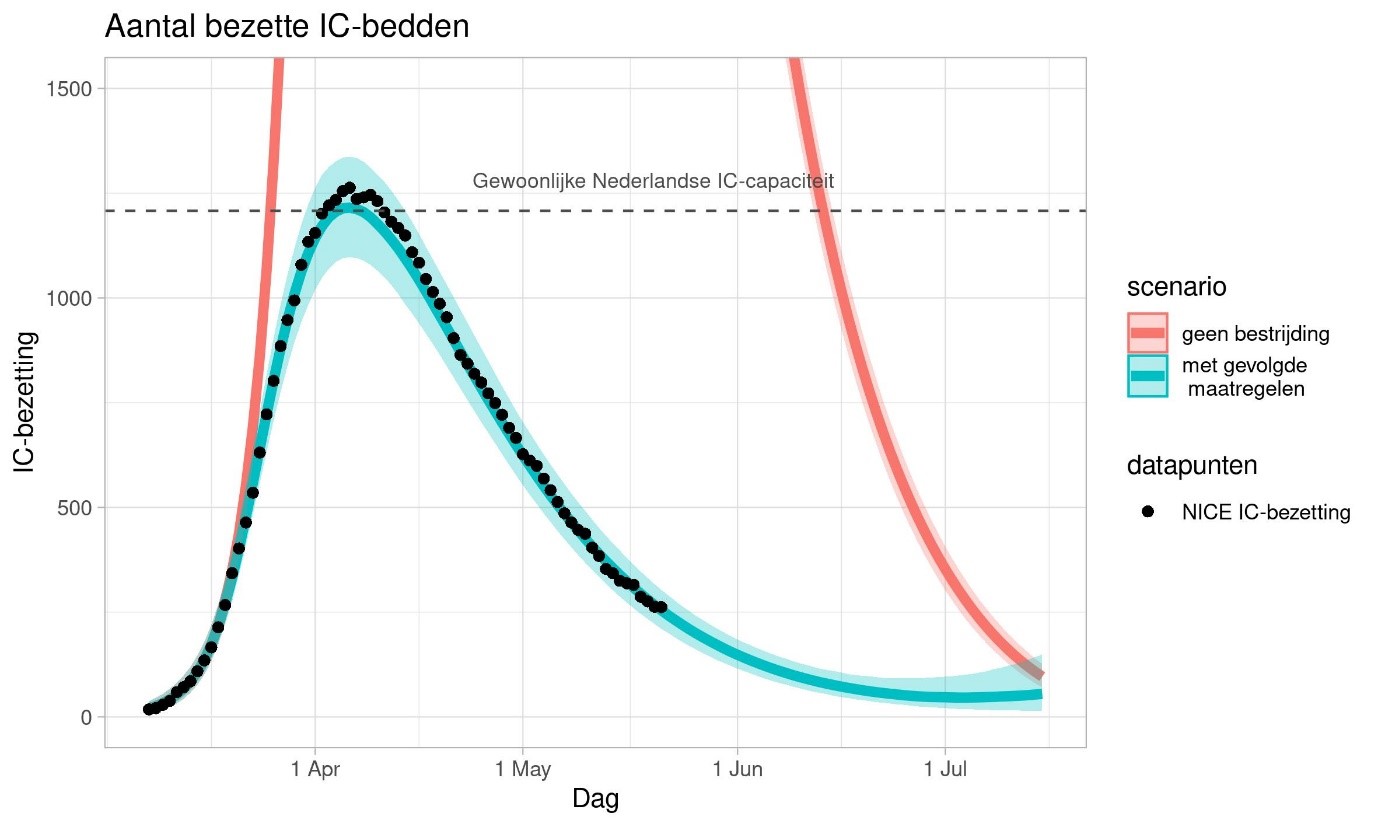
By now, we know quite a lot about containing the spread and flattening the curve of the COVID-19 epidemic. The chart above shows calculations for the effect of the measures on ICU capacity in the Netherlands. The red line represents a scenario in which the Netherlands does not take any measures. The thick blue line on the chart represents the most likely scenario. The blue shaded region indicates the margins of uncertainty. The margins of uncertainty are smaller than they were at the beginning of the outbreak because we know more about how disease spreads now. The actual line is somewhere within that blue shaded region.
What do modelling results look like?
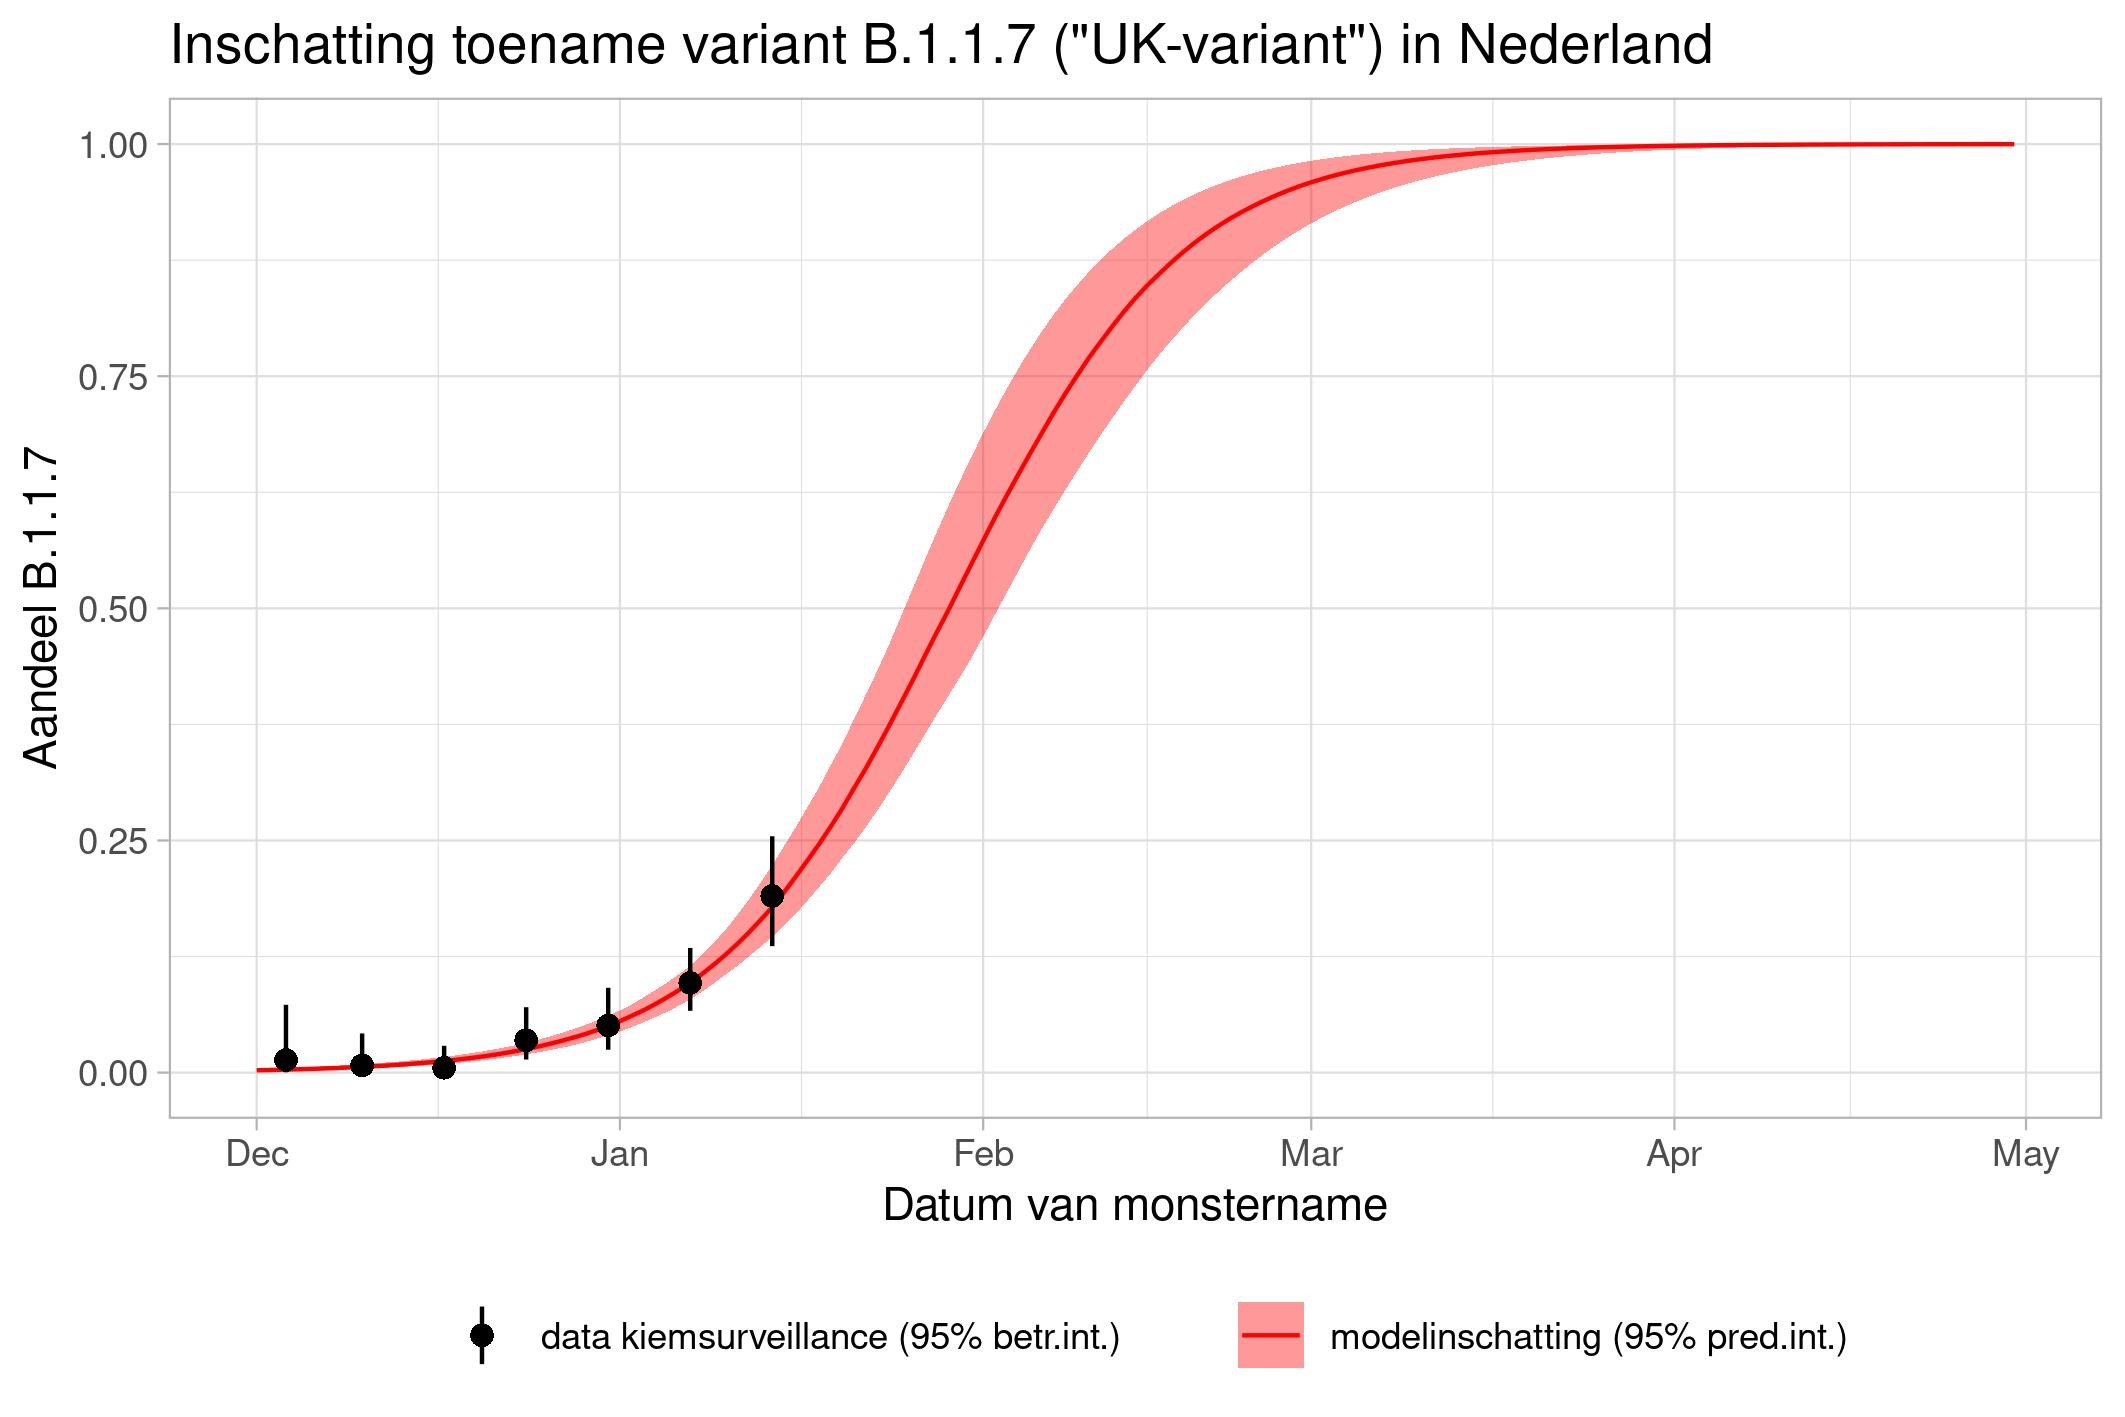
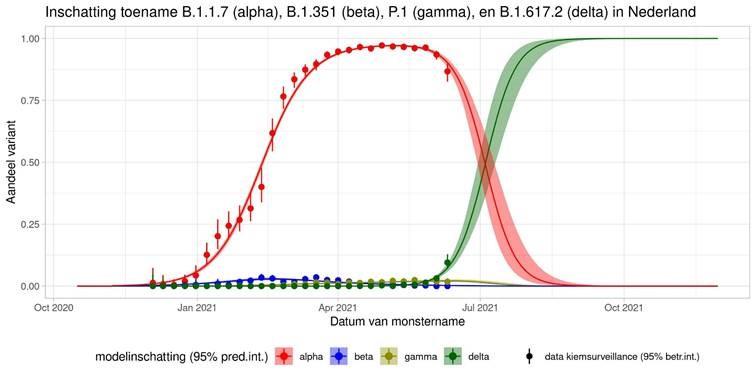
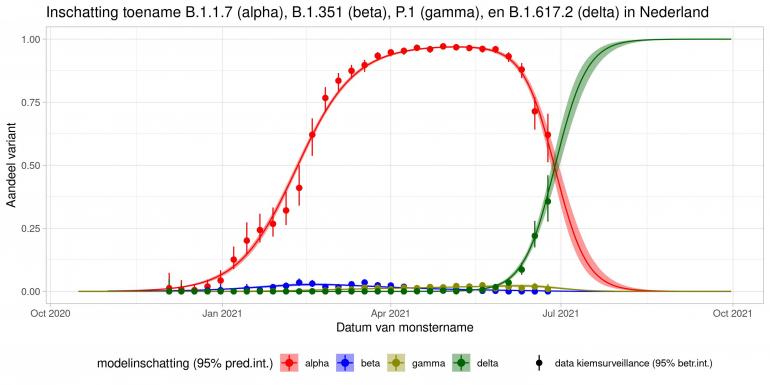
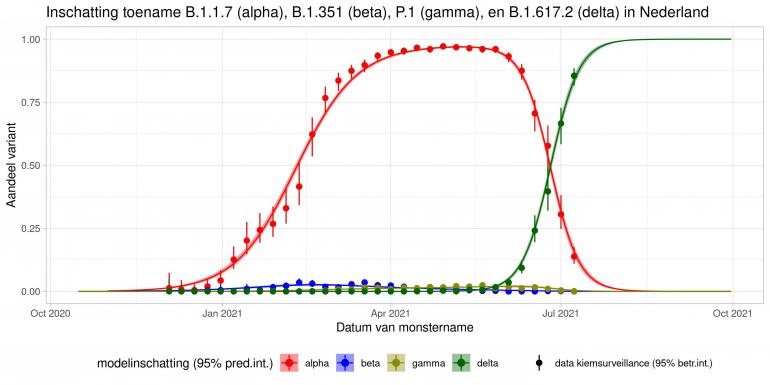
These are calculations that RIVM made to estimate the percentage of the different variants. Each variant has been labelled: the Alpha variant (first identified in the UK) is officially designated B.1.1.7, while Beta (South Africa) is B.1.351, Gamma (Brazil) is P.1, and Delta (India) is B.1.617.2.
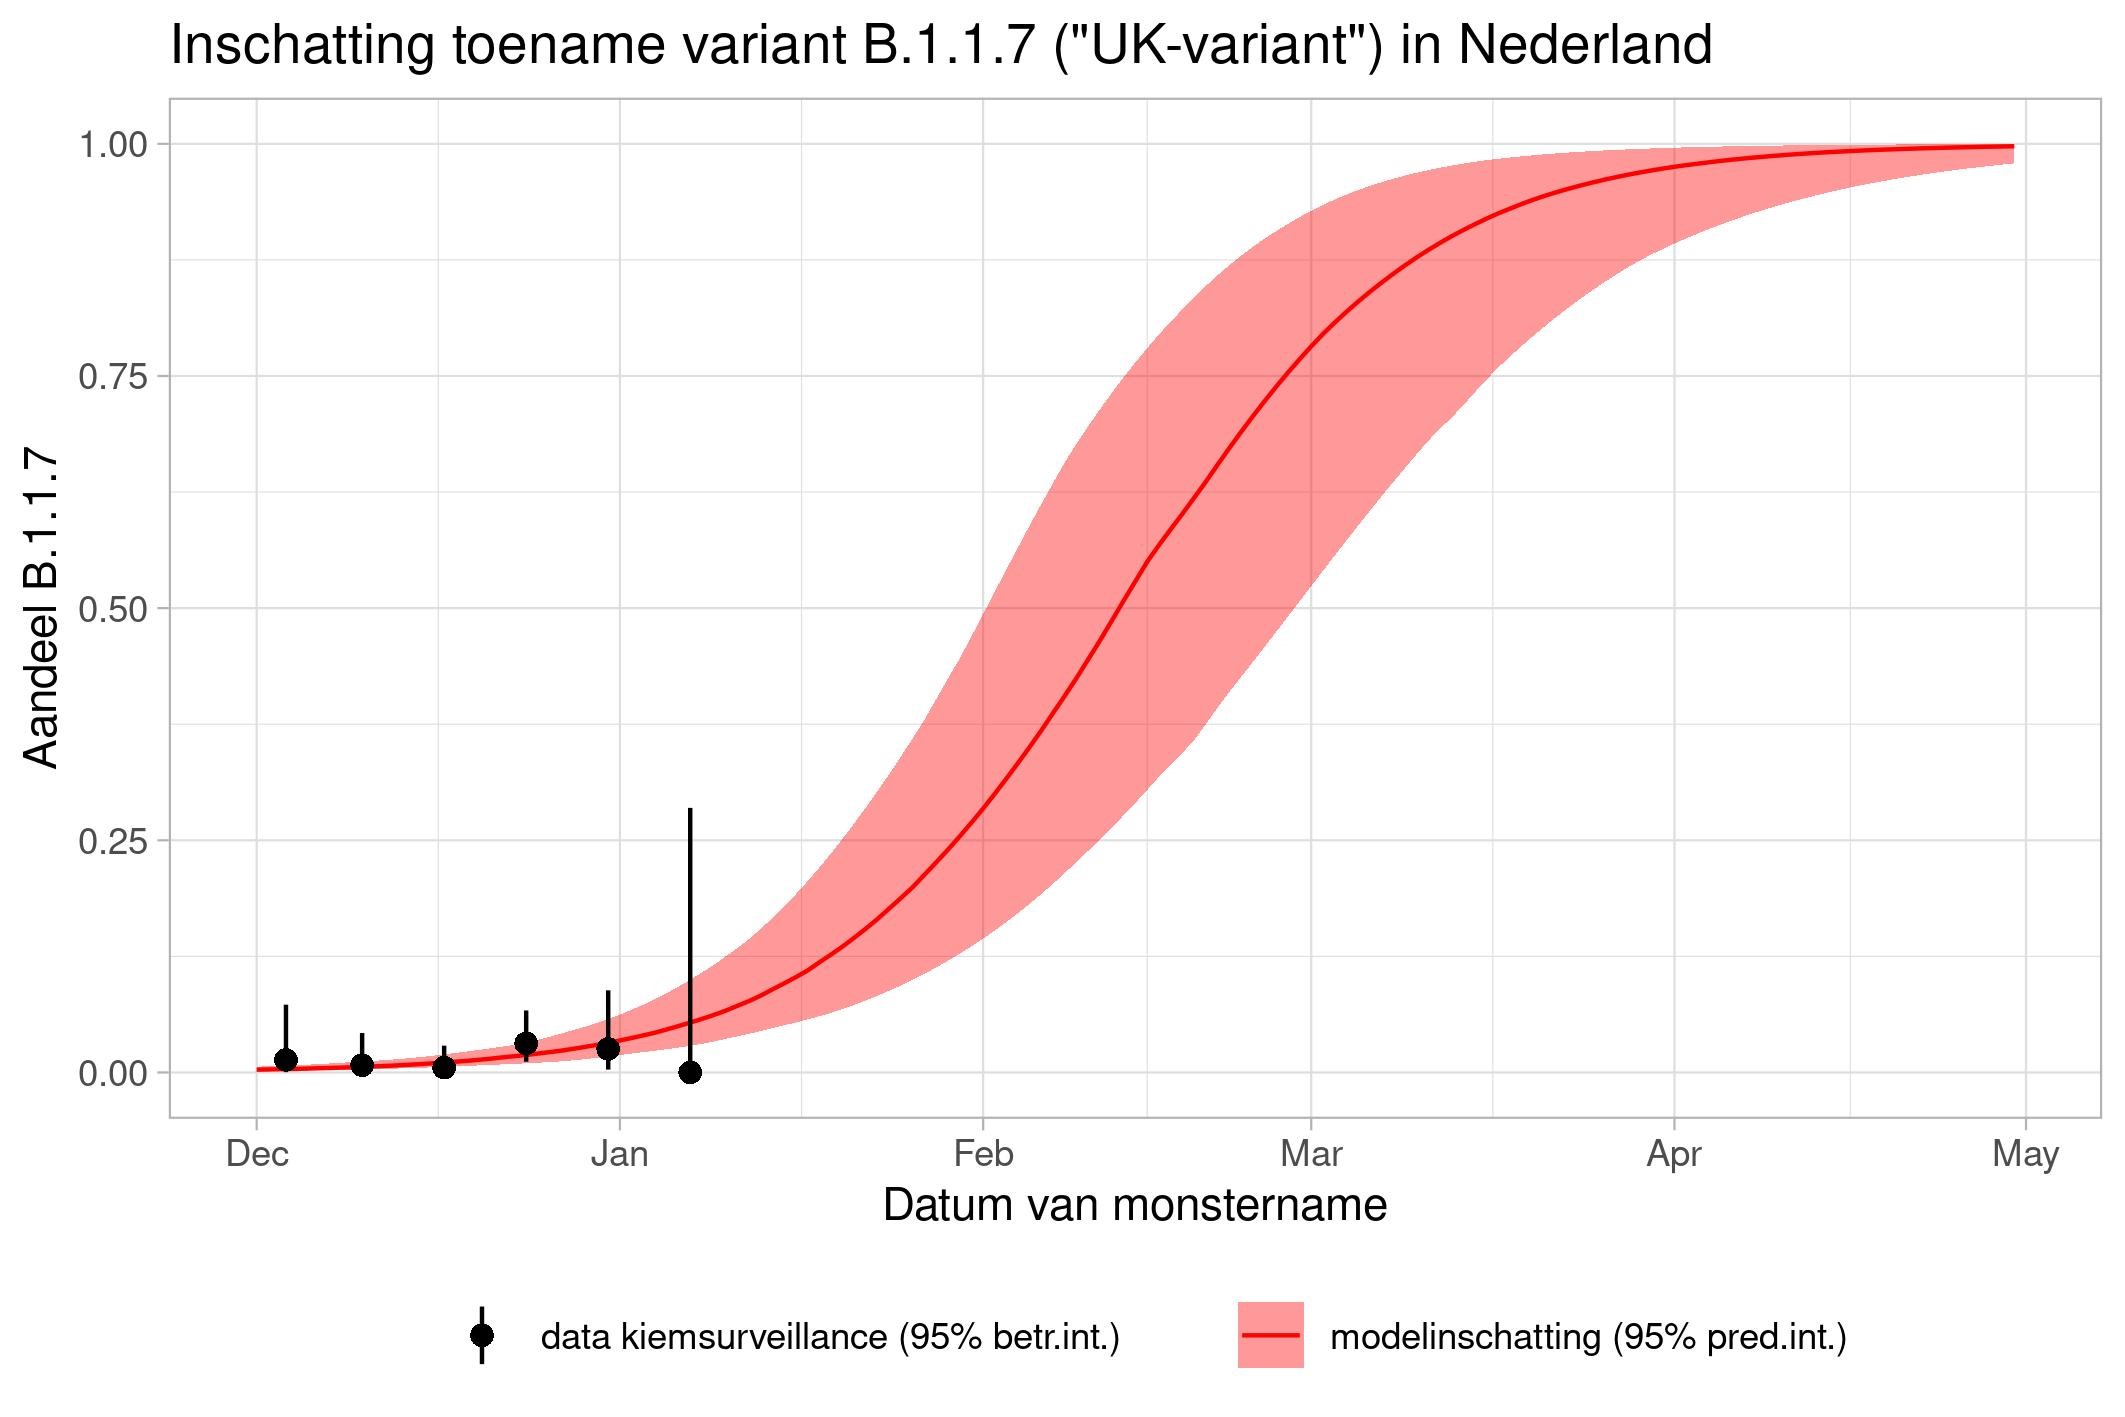
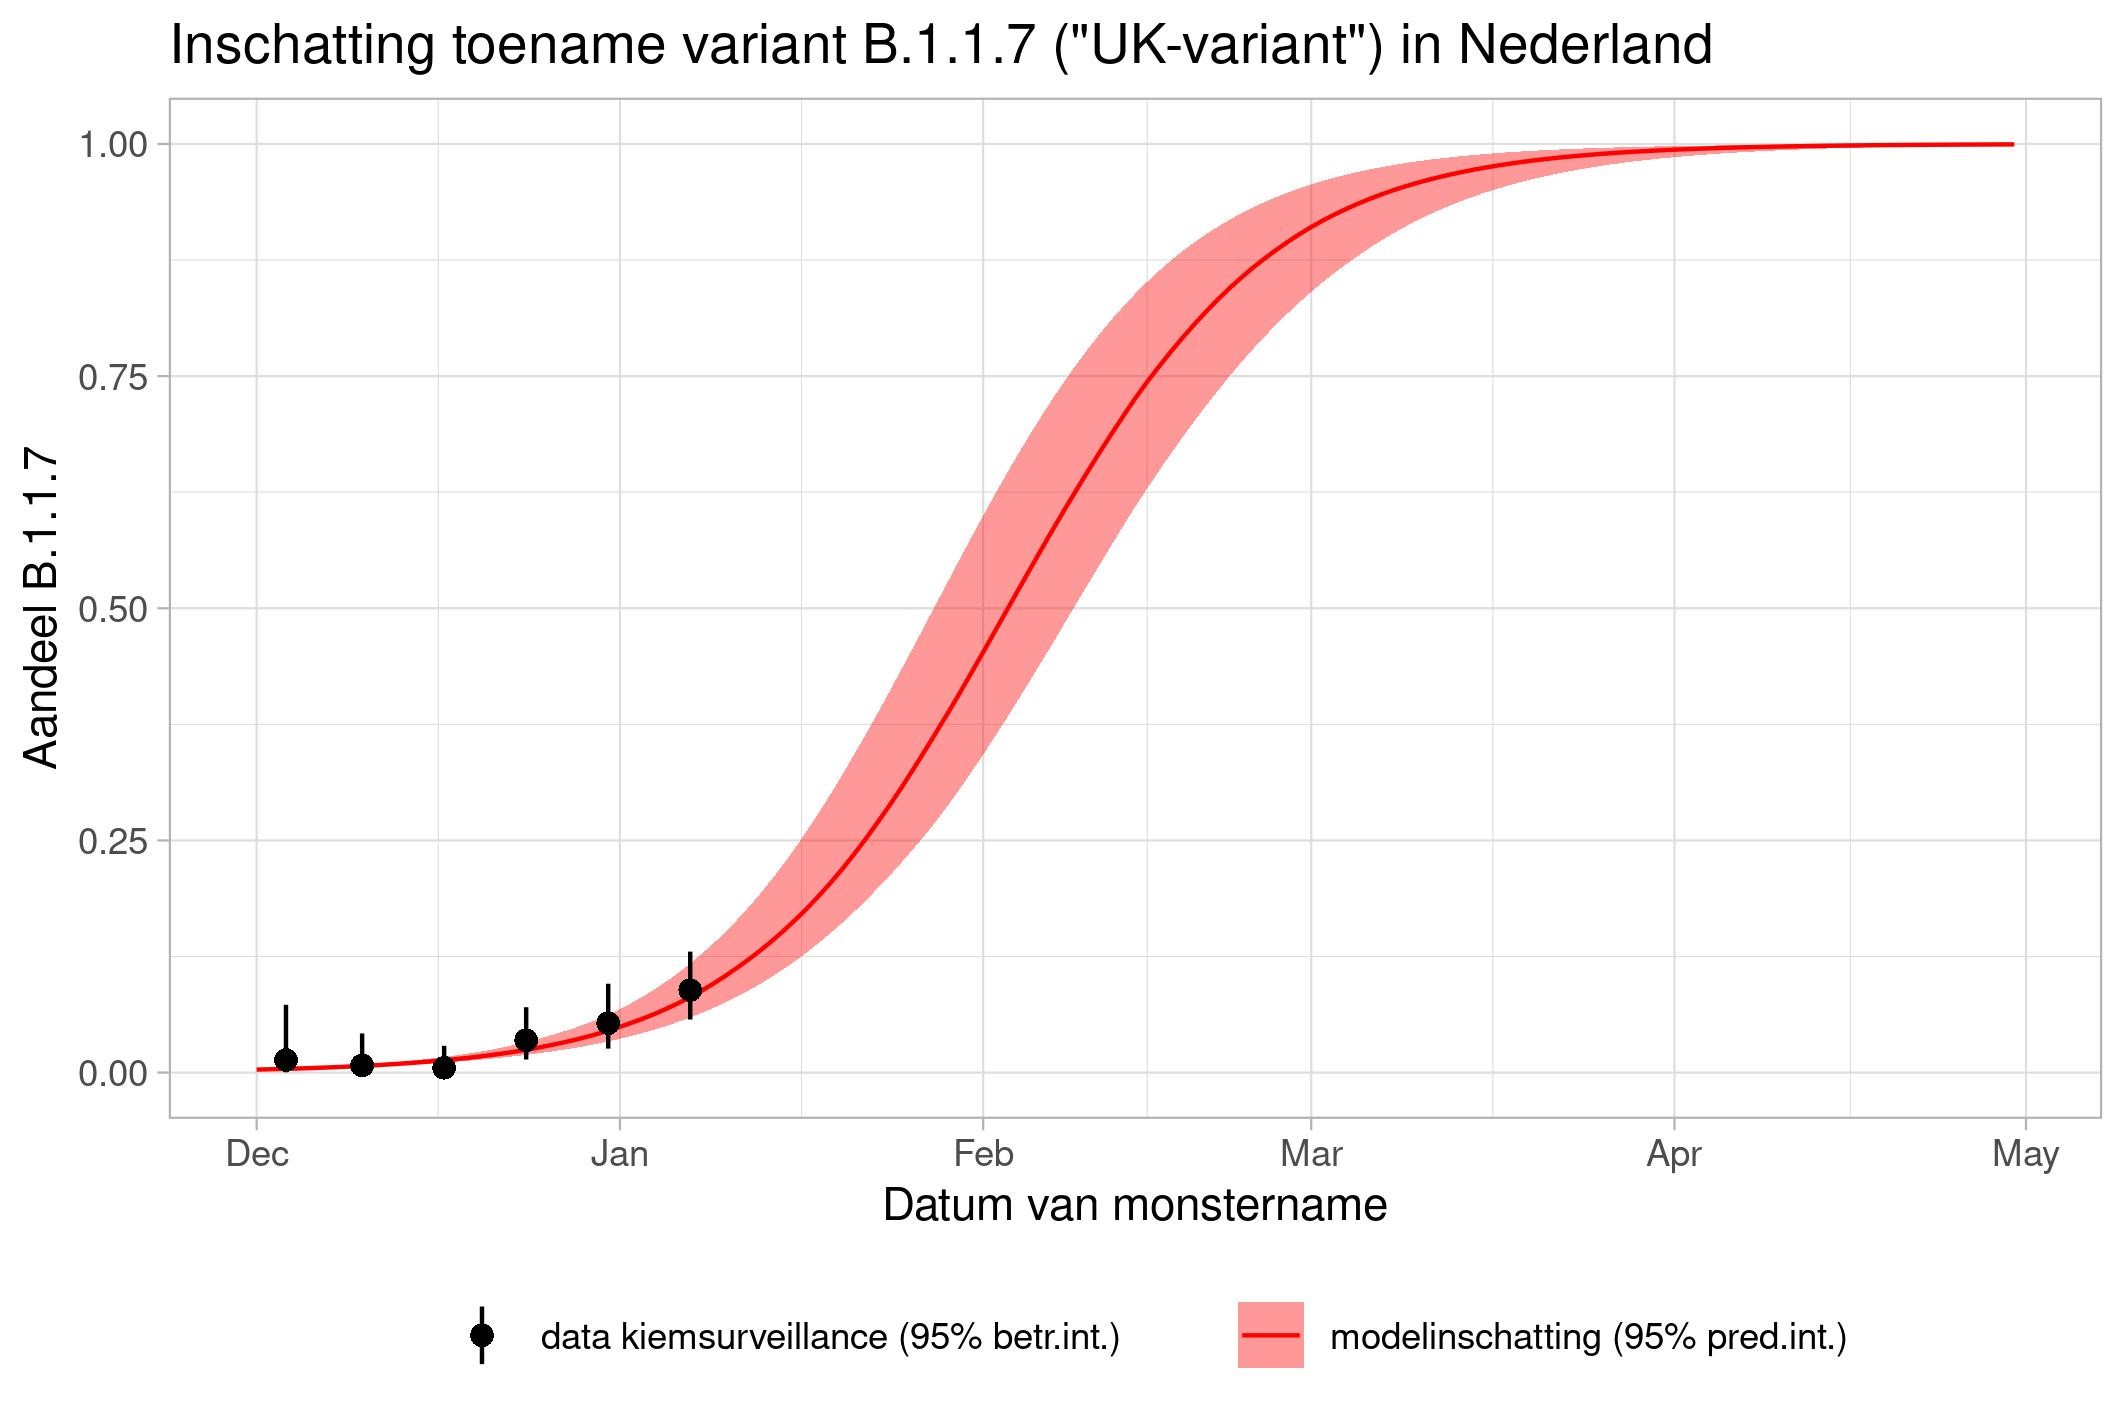
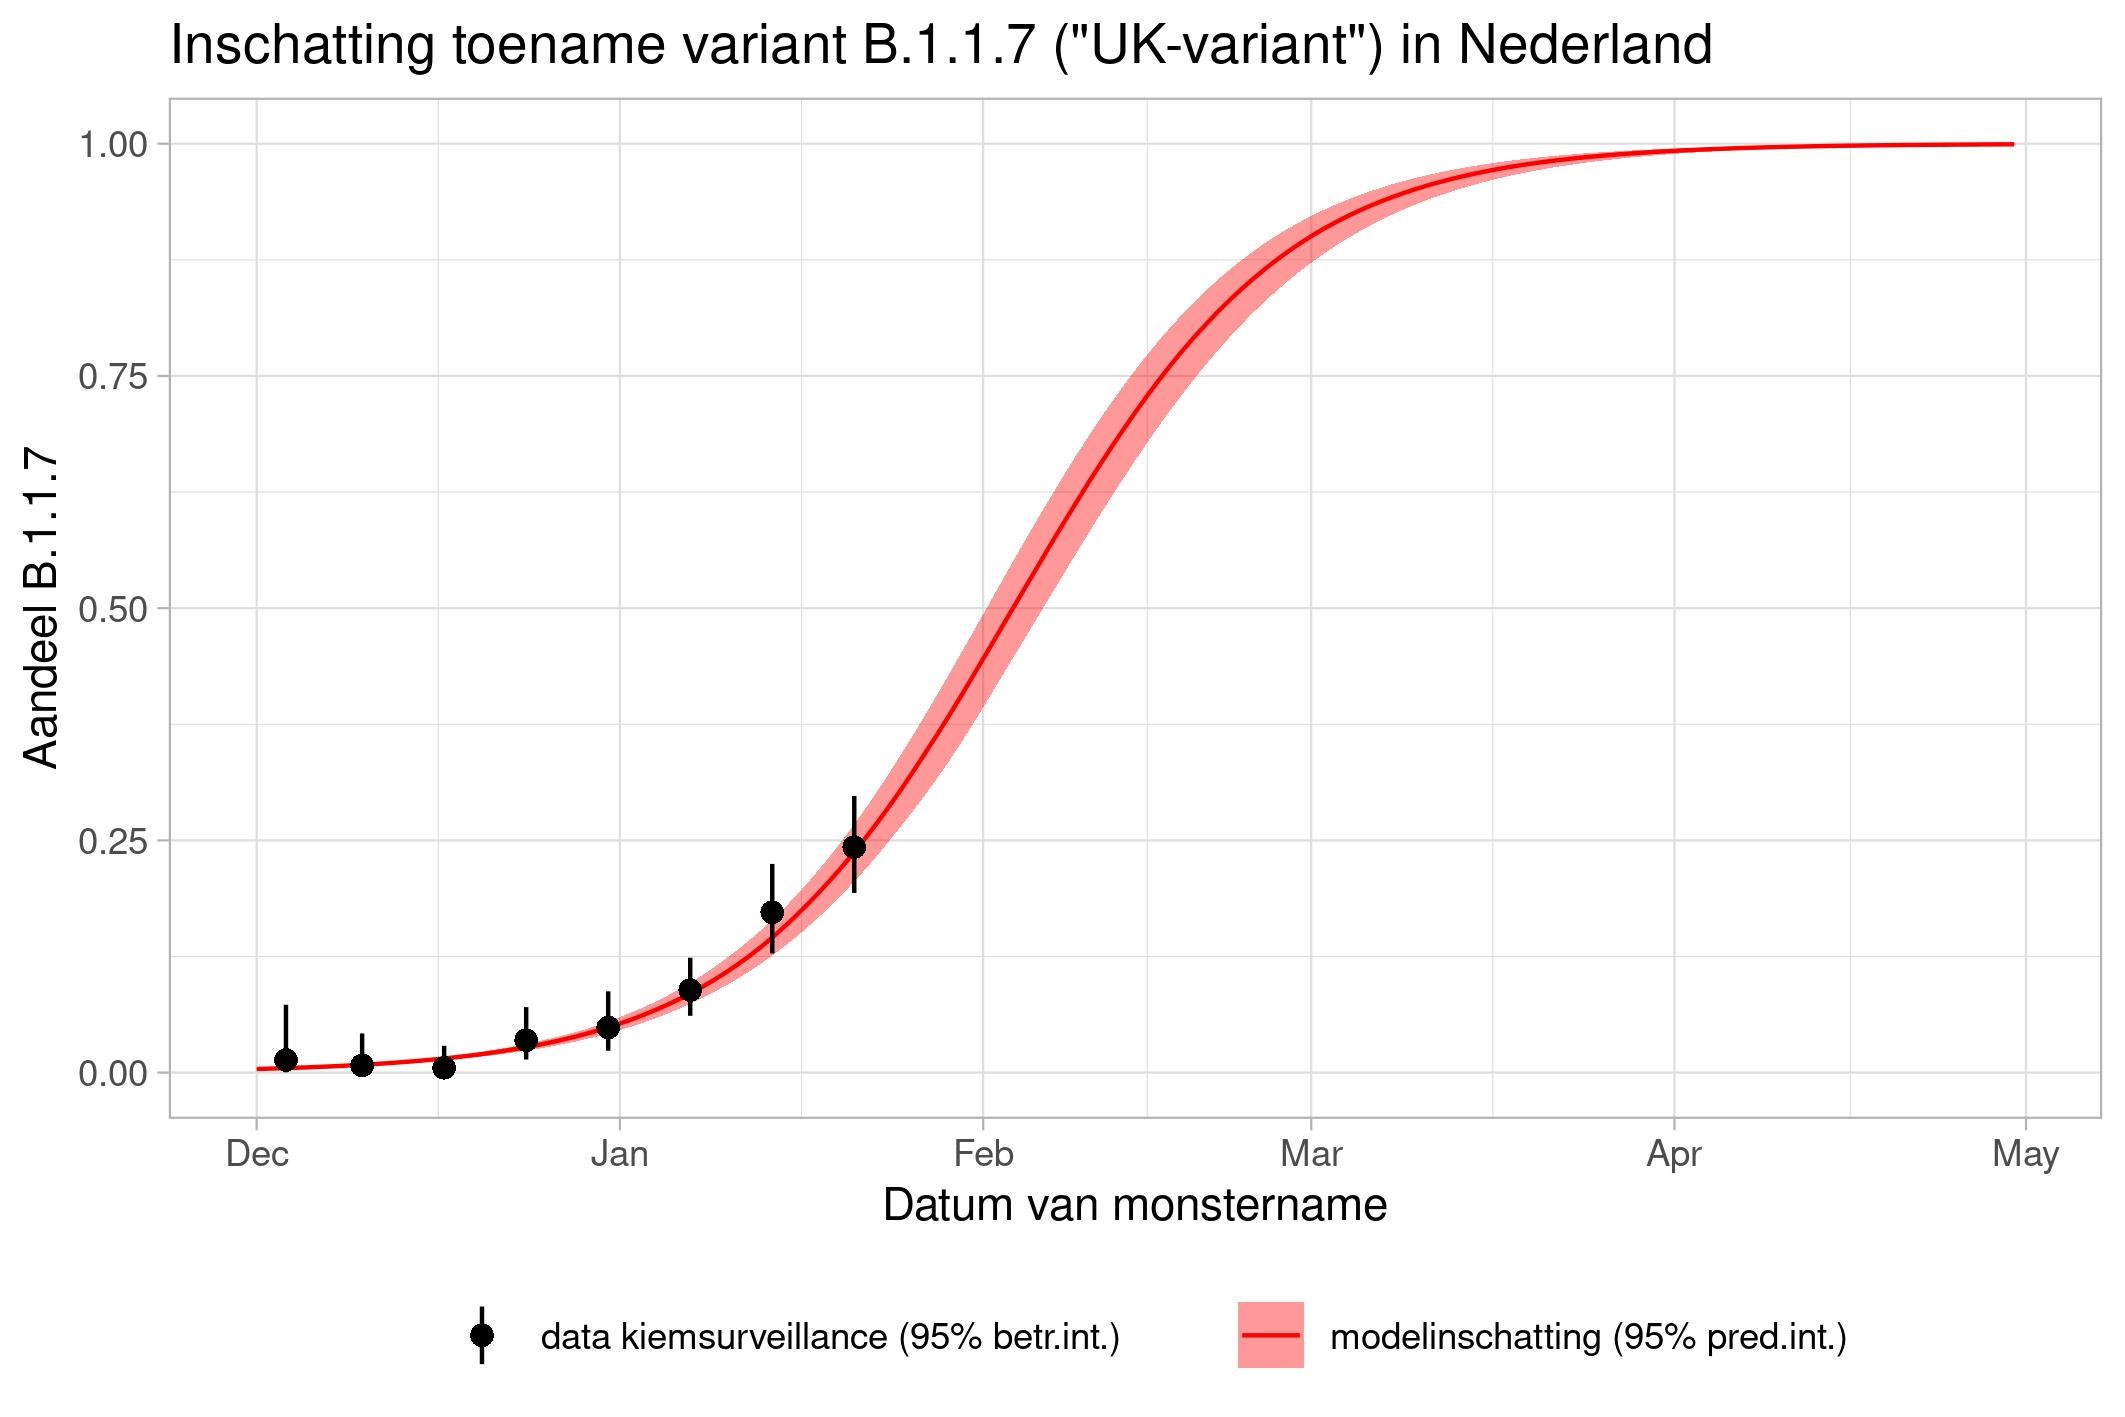
The lines show the estimates for the variants. The bands on either side of the lines represent uncertainty. The dots indicate the measurements from pathogen surveillance, while the vertical lines indicate the associated margins of uncertainty. This was a prediction that was later updated by adding the actual number of reported infections. As you can see, the calculations are constantly updated based on the latest data.
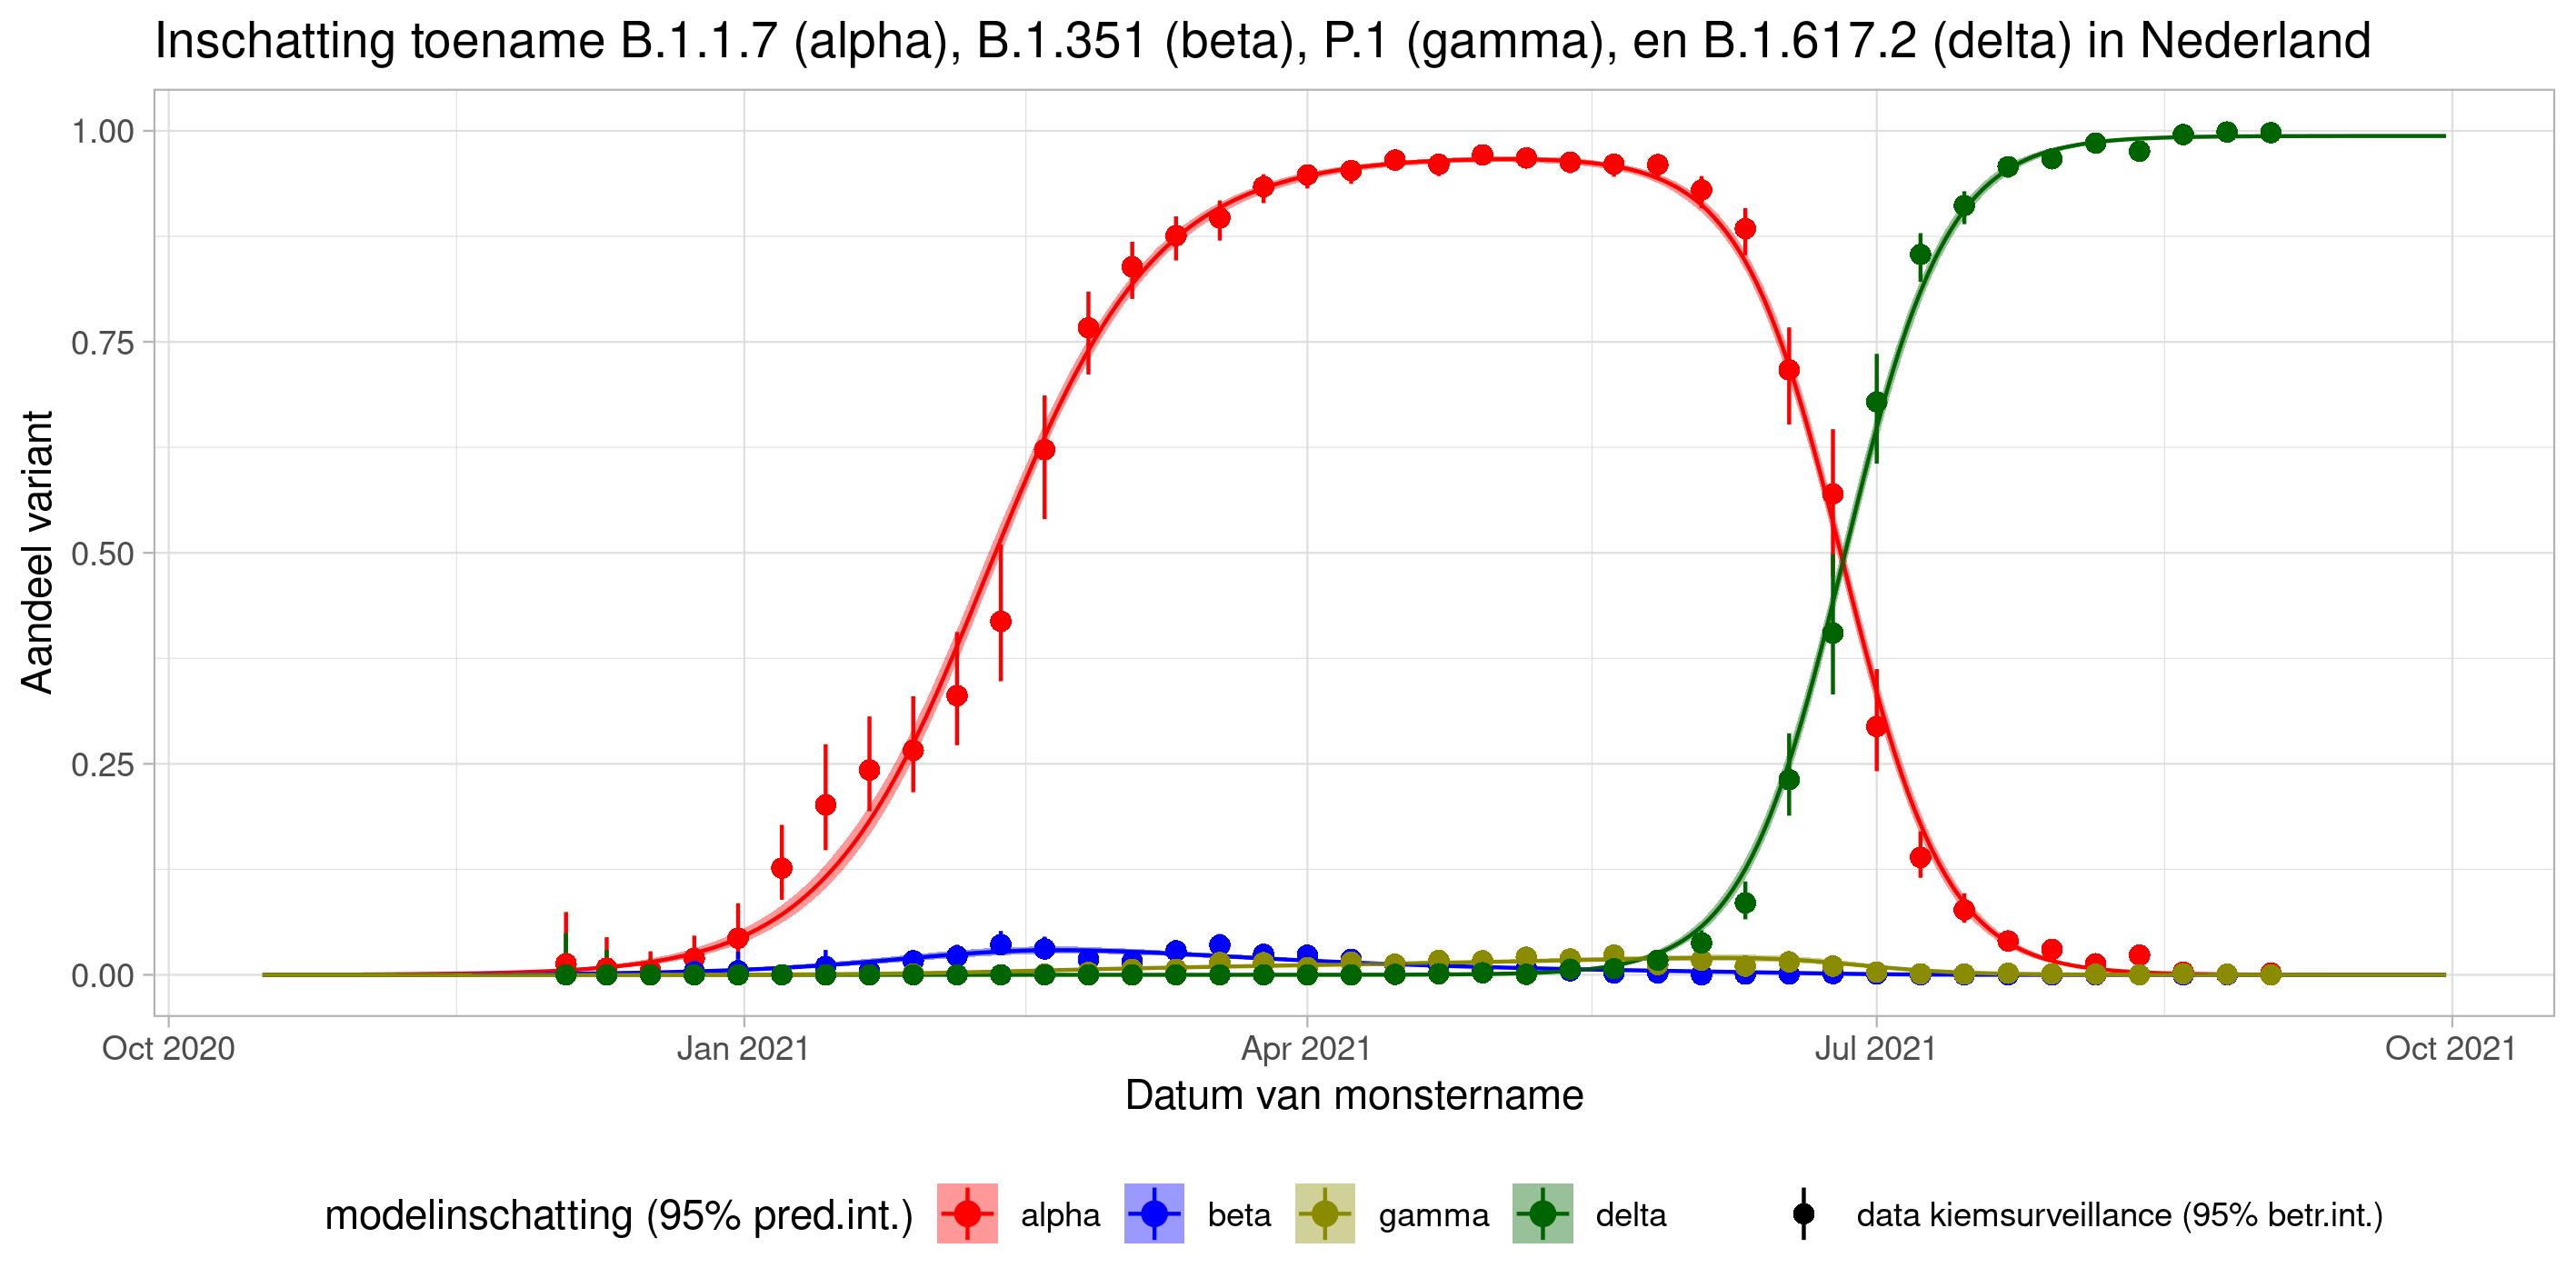
*This forecast assumes that vaccines provide equal protection against all variants. The margins of uncertainty are wide.
13 January
20 January
27 January
3 February
23 June
9 July
23 July
30 July

6 August 2021

13 August 2021
What safeguards are in place to ensure the quality of the models?
RIVM offers its models and research results for publication in international peer-reviewed journals. International experts then assess the manuscript, the models, and the results. These experts often provide comments and feedback anonymously; the model and the results are only published once the experts have approved them. When the results are published, the codes and data that we used are also released to the public.
Speed is important for purposes of crisis management and policy advice. In order to guarantee the same quality, we build on models and algorithms that have already passed the peer review process. RIVM shares and compares this information with all sorts of organisations in the Netherlands and abroad, including the World Health Organisation (WHO) and the European Centre for Disease Prevention and Control (ECDC), and with health institutes in other European countries. Many of the policy recommendations also have added value for research purposes. Also, after the models and results are used for crisis management and policy advice, they are then used for further research, which is then subjected to peer review before publication.