Text version of the poster.
You can download the poster at the right side of this page.
Authors
Natalie Cleton 1,2, Chantal Reusken 1, Johan Reimerink 2, Gert-Jan Godeke 2, Kees van Maanen 3, Jeroen Kortekaas 4, Richard Bowen 5, Marion Koopmans 1,2
- Department of Viroscience, Erasmus MC, Rotterdam, the Netherlands
- Department of Virology, RIVM, Bilthoven, the Netherlands
- Animal Health Services, Deventer, the Netherlands
- Central Veterinary Institute, Lelystatd, the Netherlands
- Colorado State University, Department of Biomedical Science and Veterinary Medicine, Fort Collins, CO, USA
Background
Arthropod borne viruses are transmitted by vectors and are sustained in a complex, often zoonotic transmission cycle between mammalian hosts and arthropod vectors.
They can cause disease in humans and animals ranging from rash and incapacitating arthralgia to life threatening haemorrhagic fever and encephalitis.
Diagnosis is based predominantly on serology, as viremia is often short-lived.
Arboviruses co-circulate, and therefore, persons and animals can be exposed to multiple arboviruses simultaneously.
Objectives
To develop novel strategies to identify emerging arboviral threats by developing and combining laboratory-based tools and epidemiological models that can be used for risk and exposure profiling.
Method
We developed a cross-species protein microarray for humoral
immune response profiling of antibodies to flaviviruses,
alphaviruses and phleboviruses.
Target antigens NS1 protein for flaviviruses, E1 and E2 for
alphaviruses and glycoprotein n-terminus for bunyaviruses were
selected, produced and spotted onto nitrocellulose pads using a
PerkinElmer non-contact protein array spotter (table 1).
Table 1: Viruses for which antigens were selected, spotted on protein microarrays and tested.
|
Genus |
Serogroup |
Virus |
Abbreviation |
Species pos. serum |
|---|---|---|---|---|
|
Alphavirus |
Semliki Forest Virus |
chickungunya virus |
CHIKV |
Human |
|
|
|
mayaro virus |
MAYV |
- |
|
|
|
|
|
|
|
Bunyavirus |
Phlebovirus |
Rift Valley fever virus |
RVFV |
Sheep |
|
|
|
|
|
|
|
Flavivirus |
dengue virus |
dengue virus 1 |
DENV1 |
Human |
|
|
|
dengue virus 2 |
DENV2 |
Human |
|
|
|
dengue virus 3 |
DENV3 |
Human |
|
|
|
dengue virus 4 |
DENV4 |
Human |
|
|
Japanese encephalitis virus |
Japanese encephalitis virus |
JEV |
Human, horse, birds |
|
|
|
West Nile virus |
WNV |
Human, horse, chicken |
|
|
|
usutu virus |
USUV |
Human, rabbit |
|
|
|
St. Louis encephalitis virus |
SLEV |
Human |
|
|
yellow fever virus |
yellow fever virus |
YFV |
Human, monkey |
|
|
spondweni virus |
Zika virus |
ZIKV |
- |
|
|
tick-borne encephalitis virus |
tick-borne encephalitis virus |
TBEV |
Human |
Serum samples from humans, horses and sheep with virologically and/or serologically confirmed arboviral infections and control sera of non-exposed individuals were incubated in serial 2-fold dilutions followed by incubation with a species specific IgG and IgM Cy5-labeled conjugate.
After quantifying signals using a Tecan scanner, data were analyzed in ‘R’.
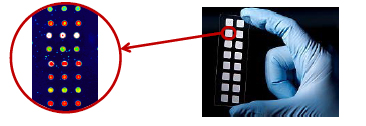
Figure 1: Nitrocellulose protein microarray slides (http://www.scienion.com/)
Results
Profiling of antibodies in human patients exposed to
flaviviruses showed highly discriminatory patterns of reactivity to
their corresponding flavivirus antigens with sensitivities and
specificities ranging from 87%-100 (P0,01) (figure 2).
YFV, JEV and TBEV vaccinated
individuals produced no titers to all flavivirus antigens
comparable to negative controls and therefore could be
distinguished from non-vaccinated individuals that had acquired a
flavivirus infection (figure 2).
The CHIKV antigens had a sensitivity and specificity
of 100% for serological diagnosis of CHIKV infected
patients, with no cross reactivity when testing serum from closely
related sindbis virus infected patients.
Figure 2: A dot distribution graph displaying the distribution of the fluorescent signal strength (y axis) of confirmed positive serum samples and negative and vaccinated controls by individual virus (x axis) for IgG positive serum samples in a 1:20 dilution
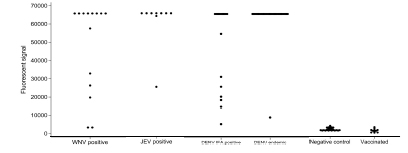
Samples in figure 2:
WNV positive: Patients with VNT and ELISA confirmed
WNV infections
JEV positive: Patients with VNT and
ELISA confirmed JEV infections
DENV IFA
positive: Patients with only DENV IFA
positive infections
DENV endemic: Patients with PCR and ELISA
confirmed DENV infections from DENV
endemic countries
Negative controls: Blood donation patients with no
WNV, DENV and TBEV
infections confirmed by IFA and ELISA
Vaccinated: Patients vaccinated against YFV or
JEV with VNT and IFA
confirmed titers.
Figure 3: Bar graphs representing patients’ antibody responses in titers towards one specific virus (patient A and B) or multiple viruses (patient C)

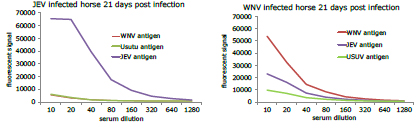
Initial results showed high sensitivity and specificity of RVFV serology for sheep, and JEV serology for horses. WNV infected horses produced cross-reactive antibodies to JEV and USUV antigens on the protein microarray, but the highest titer was produced by the WNV antigens (figure 4)
Figure 4: Serial dilutions of serum from JEV and WNV infected horses displaying a specific response to JEV antigens and a more cross-reactive response to WNV antigens.
Conclusion
The first generation protein microarray can be used to determine exposure to flaviviruses, alphaviruses and bunayvirus in humans and animals.