
The number of reported COVID-19 infections continued increasing last week. However, the number of newly reported infections once again rose less quickly than in the week before that. This is probably the effect of the measures that were implemented at the end of September and in mid-October. The number of patients in hospital and the number of ICU admissions is still increasing rapidly.
67,542 new COVID-19 cases were reported last week, an increase of nearly 12,000 (22%) compared to the week before, when cases increased by 27%. In the week before that, this figure rose by 60%. The difference between the number of newly reported infections in younger and older age groups grew smaller again this week (see Figure 1).
*Not all commercial providers of validated tests are currently reporting positive test results to the Municipal Public Health Services (GGDs).

Figure 1: Number of confirmed cases per 100,000 inhabitants, by age group, from 14 Sep to 25 Oct.
Differences between the regions
There are major differences between the regions in the number of reported infections per 100,000 inhabitants. The number of reported infections per 100,000 inhabitants was highest in the regions of Rotterdam-Rijnmond, Zuid-Holland-Zuid, Twente, Amsterdam-Amstelland and Holland-Midden, with over 500 reported infections per 100,000 inhabitants. The number of newly reported infections rose most rapidly in the regions of Zuid-Holland-Zuid, Twente en Limburg-Zuid (55-75%).
GGD test lanes and percentage of positive tests
In the week of 19 - 25 October, 321,654* people were tested in the GGD test lanes, nearly 12,000 people more than in the week before. The test results for 285,227 people are known. 51,166 of those people tested positive for COVID-19. As a result, the percentage of positive tests rose to 17.9%. There are major differences between the regions. The regions with the lowest percentage of positive tests were Groningen and Fryslân; the regions with the highest percentages were Rotterdam-Rijnmond, Zuid-Holland-Zuid, Haaglanden and Twente.
Testing capacity in the GGD test lanes has been expanded in recent weeks. The interval between making an appointment, getting tested, and getting the result is currently 2.5 days.
It continues to be important to always get tested if you have mild symptoms that could indicate COVID-19 – even if you think it might just be a common cold.
*Source: GGD GHOR

Figure 2: Left: the number of positive COVID-19 tests reported by the GGD per security region last week (21-27 October). Right: the percentage (%) of positive tests in the GGD test lanes per security region in the past calendar week.
Hospital admissions increased, and more deaths were reported
Last week, the NICE Foundation recorded 1,739 new admissions to the nursing wards; there were 1,492 admissions to nursing wards in the week before that. This is an increase of nearly 17% compared to the week before that. There were 333 new admissions to intensive care due to COVID-19 last week, compared to 287 ICU admissions in the week before that; this is a 16% increase.
Continuing the trend of the previous three weeks, Statistics Netherlands (CBS) reported a higher mortality rate than expected in the week of 12 to 18 October. 400 more people died in that week than expected on the basis of the data from previous years. RIVM also keeps tracks of mortality figures on a weekly basis. In the most recent RIVM data for 8-14 October, mortality was elevated in the age category of 65-74 years and slightly elevated in the age category of 75 years and older.

Figure 3: Total mortality in the Netherlands until 14 October. The observed mortality is compared to the number of deaths expected on the basis of previous years. The yellow band on the graph shows the mortality rate that would be expected at that time of year. *source: RIVM and CBS.
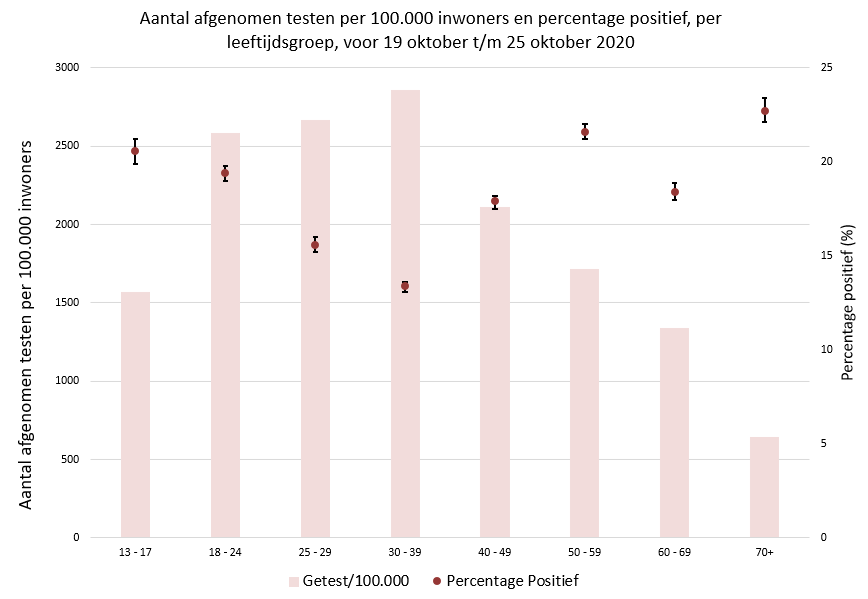
Figure 4: Differences in number of tests and percentage of positive tests, per age group, for the past calendar week.
Reproduction number R
The reproduction number for 9 October* is 1.15 (lower limit: 1.13, upper limit: 1.18). This is hardly lower than a few weeks ago, and the confidence interval is still entirely above 1. A reproduction number of 1.16 means that 100 people with COVID-19 will collectively infect another 116 people with the virus.
*The estimates for R from longer than 14 days ago are reliable. An estimated R based on data from less than 14 days ago involves more uncertainties and is less reliable. That is why we always look at the R from 14 days ago.
Number of contagious people in the Netherlands
The number of contagious people is now over 160,000 (with a lower limit of 117,000 and an upper limit of over 203,000).
Slow down the virus? Prevent the spread? Follow the basic measures!
To prevent the virus from continuing to spread, it is important for everyone to comply with the measures and the basic rules. Stay at least 1.5 metres from others. Work from home. If you have symptoms, stay home and get tested. Wash your hands frequently, especially when you arrive at home. Sneeze and cough into your elbow.
Daily figures
RIVM publishes a weekly overview of the number of infections, hospital admissions and ICU admissions, and people who have died from the consequences of COVID-19. Daily figures (which are corrected for later updates in some media, and not in others) may fluctuate dramatically as delayed reports come in, and are therefore less suitable for monitoring the course of the epidemic.
| Last week1 | Two weeks ago2 | |
|---|---|---|
| COVID-19 reports by Municipal Public Health Services (GGDs) | ||
| Newly reported COVID-19 infections | 67,542 | 55,587 |
| Number of hospital admissions to nursing wards (Source: NICE) | 1739 | 1492 |
| Number of hospital admissions to Intensive Care (Source: NICE) | 333 | 287 |
| Deaths | 329 | 185 |
| GGD test lanes per calendar week3 | week 43 | week 42 |
| Total number of tests of which results are known | 285,227 | 310,716 |
| Number of people who tested positive | 51,166 | 47,082 |
| Percentage of positive tests | 17.9% | 15.2% |