The RIVM reports the weekly number of deaths based on data from Statistics Netherlands (CBS). Based on the reported number of deaths, the RIVM estimates whether there is incidental excess mortality. This means that more people die in a certain period than expected based on mortality numbers from previous years. Previous peaks in incidental mortality are excluded when determining expected mortality. Often, excess mortality coincides with a significant event, such as an influenza epidemic, a heatwave or cold spell, or the COVID-19 pandemic. Over the past five years (2020–2024), the average number of deaths in the Netherlands was 3,263 per week. More background information about this mortality monitoring can be found in the document 'Background and methods on respiratory surveillance 2024/2025'. The weekly reported mortality does not include information about causes of death.
Excess mortality in seven weeks of the 2024/2025 respiratory season
During the respiratory season of 2024/2025 (from week 40 in 2024 through week 20 in 2025), excess mortality was observed in 7 out of 33 weeks. This period lasted from week 2 through week 9 of 2025, except for week 3 when there was no excess mortality. The period of excess mortality in the 2024/2025 season mostly overlapped with the influenza epidemic (with influenza type A being dominant) from week 3 to week 11. Excess mortality during the 2024/2025 respiratory season was highest among people aged 80 years and older.
In week 8 of 2025, excess mortality was at its peak. That week, a total of 4,104 people died, which is 594 more deaths than expected based on previous years. This excess mortality was slightly higher than during the peak week in the 2023/2024 respiratory season, when excess mortality was 551. However, the excess mortality peak was much lower than during the COVID-19 pandemic (2020 to 2023). In those peak weeks 14, 1, 48, and 51, there were 2,139, 1,076, 1,296, and 885 more deaths than expected, respectively. During the increases of the coronavirus SARS-CoV-2 (the virus that causes COVID-19) in the summer (weeks 24 to 32) and autumn (weeks 36 to 46) of 2024, there was, for the first time in the period after the pandemic, no significant incidental excess mortality observed.
Total excess mortality in recent respiratory seasons
During the 33 weeks of the 2024/2025 respiratory season, total excess mortality was 926. This excess mortality was lower than in the respiratory seasons 2020/2021 through 2023/2024. In a large part of those previous respiratory seasons, the COVID-19 pandemic was still ongoing and the total excess mortality was 15,299, 13,180, 7,130, and 4,347, respectively. There was also less excess mortality in the past respiratory season than in the five seasons before the COVID-19 pandemic (an average of 7,285 excess deaths per respiratory season from 2014/2015 through 2018/2019).
Total excess mortality during influenza epidemic
During the 9 weeks of the influenza epidemic, the total excess mortality was 3,342. This is slightly higher than in the previous year’s influenza epidemic (2,073 in 2023/2024) but lower than in the two years before that (5,593 in 2022/2023, and 3,686 in 2021/2022).
Table 1. Total number of excess deaths from July through June and during the influenza epidemics from 2015/2016 through 2024/2025.
| Season | Total excess mortality from July until June | Number of weeks from July until June | Total excess mortality during influenza epidemic | Number of weeks of influenza epidemic |
|---|---|---|---|---|
| 2015/2016 | 7,982 | 53 | 4,046 | 11 |
| 2016/2017 | 9,900 | 52 | 7,400 | 16 |
| 2017/2018 | 7,952 | 52 | 9,297 | 18 |
| 2018/2019 | 2,763 | 52 | 2,410 | 14 |
| 2019/2020* | 12,727 | 52 | 757 | 5 |
| 2020/2021* | 16,684 | 52 | No Influenza epidemic | No Influenza epidemic |
| 2021/2022* | 16,323 | 53 | 3,686 | 13 |
| 2022/2023* | 8,827 | 52 | 5,593 | 14 |
| 2023/2024 | 2,708 | 52 | 2,073 | 9 |
| 2024/2025** | 652** | 50** | 3,342 | 9 |
*COVID-19-pandemic in the Netherlands. The COVID-19 epidemic began in March 2020. The WHO declared the end of the pandemic on 5 May 2023. **For the period from July to June 2024/2025, excess mortality has been calculated up to and including week 24 of 2025 (9–15 June 2025) and is therefore not yet fully complete.
Figure 1. Observed and expected ('baseline') weekly number of deaths from July 2023 through June 2025 by week of death. (Source: Statistics Netherlands)
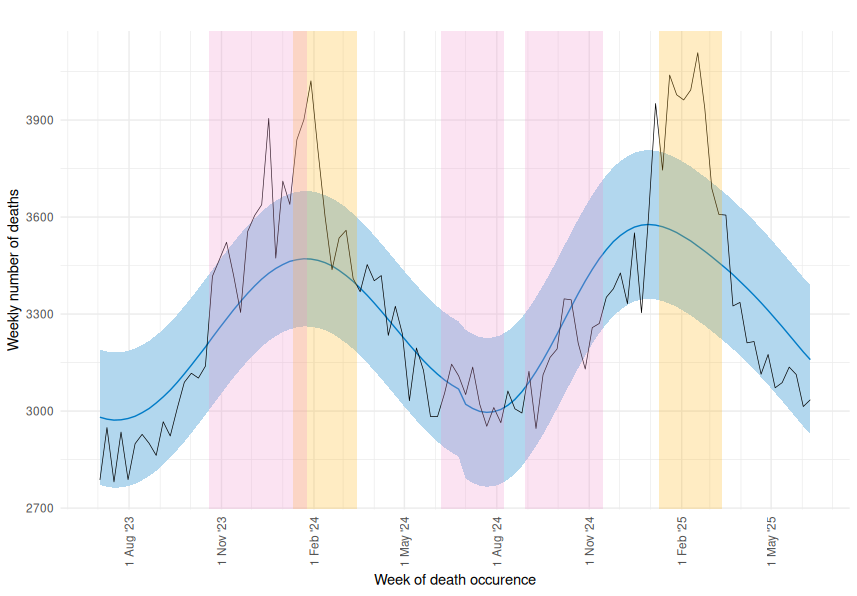
Legend:
- Black line: observed number of deaths per week
- Orange shading : weeks of the influenza epidemic
- Pink shading : weeks of increased COVID-19 circulation in the Netherlands. The COVID-19 epidemic began in March 2020. The WHO declared on 5 May 2023 that the pandemic was over.
- Blue line: the number of deaths calculated by RIVM as the baseline. This is based on mortality numbers in the previous 5 years, excluding mortality peaks. Calculations excluded the 25% highest weekly death counts in the past five years and the 20% highest death counts in July and August. The calculation uses a linear regression model with a linear time trend and sine/cosine terms to describe possible seasonal fluctuations.
- Blue band: the range of expected mortality. The upper limit of the band is the baseline mortality plus two standard deviations from the baseline. The lower limit of the band is the baseline mortality minus two standard deviations from the baseline. This means that 95% of the weekly death counts of the past five years (excluding peaks) were within the band. If the black line rises above the blue band, more people died than expected.
Figure 2. Historic trends: Observed and expected ('baseline') weekly number of deaths from July 2015 through June 2025 by week of death. (Source: Statistics Netherlands)
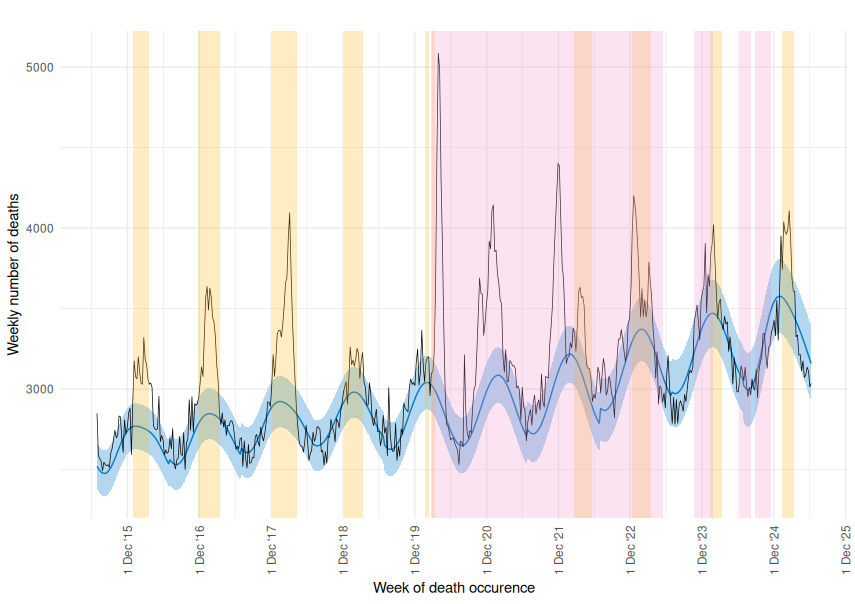
Legend:
- Black line: observed number of deaths per week
- Orange shading: weeks of the influenza epidemic
- Pink shading: weeks of increased COVID-19 circulation in the Netherlands. The COVID-19 epidemic began in March 2020. The WHO declared on 5 May 2023 that the pandemic was over.
- Blue line: the number of deaths calculated by RIVM as the baseline. This is based on mortality numbers in the previous 5 years, excluding mortality peaks. Calculations excluded the 25% highest weekly death counts in the past five years and the 20% highest death counts in July and August. The calculation uses a linear regression model with a linear time trend and sine/cosine terms to describe possible seasonal fluctuations.
- Blue band: the range of expected mortality. The upper limit of the band is the baseline mortality plus two standard deviations from the baseline. The lower limit of the band is the baseline mortality minus two standard deviations from the baseline. This means that 95% of the weekly death counts of the past five years (excluding peaks) were within the band. If the black line rises above the blue band, more people died than expected.
Contents surveillance respiratory infections
More about surveillance of respiratory infections