This page describes the surveillance of influenza in the Netherlands during the respiratory season 2023/2024.
Since most respiratory infections occur mainly in winter, the data are presented for a respiratory season or a respiratory year. A respiratory season runs from week 40 of one year to week 20 of the following year. A respiratory year runs from week 40 of one year to week 39 of the following year. In this retrospect, the data from the respiratory year 2023/2024 is limited to the respiratory season. For more details on the various surveillance sources, see the background and method document on respiratory surveillance for 2023/2024.
About the influenza epidemic of 2023/2024
The influenza epidemic of the respiratory season 2023/2024 started in week 3 and lasted 9 weeks (until week 11 of 2024). This is based on data from all available surveillance sources for influenza (virus). Only during the first four weeks of the influenza epidemic (weeks 3 to 6, 2024) the number of people consulting the general practitioner (GP) with flu-like symptoms (influenza-like illness (ILI)) did exceed the epidemic threshold of 58 per 100,000 people. However, specimens from these patients and other surveillance sources showed that there was still increased circulation of the influenza virus until week 11. Influenza virus type A was the most common this season, with influenza virus type B appearing only occasionally.
Predominantly influenza A(H1N1)pdm09
In the laboratory, the influenza viruses are subtyped. Subtype A(H1N1)pdm09 was more prevalent in 2023/2024 than subtype A(H3N2). Of the specimens taken from patients visiting the GP with flu-like symptoms, 21% had influenza virus subtype A(H1N1)pdm09 and 8% had subtype A(H3N2). Among Infectieradar participants with respiratory complaints (acute respiratory infection (ARI)), 3% tested positive for influenza virus subtype A(H1N1)pdm09 and 1% for A(H3N2).
Of the influenza specimens received by the NIC (Erasmus MC and RIVM), a total of 1,233 specimens were subtyped:
- 68% was influenza virus type A(H1N1)pdm09;
- 30% was influenza virus type A(H3N2);
- 2% was influenza virus type B of the Victoria-lineage.
Influenza A (sub)types were found in all age groups. B/Victoria was most commonly found in age groups under 50 years. Between March 2020 and the end of this reporting period (week 20, 2024), no influenza virus of the B Yamagata lineage has been found in the Netherlands. This lineage also seemed to have disappeared worldwide (Caini, Meijer et al.).
Illness from influenza virus
In the past respiratory season (2023/2024), the incidence of people with flu-like symptoms due to the influenza virus (symptomatic influenza) was estimated at 391 per 10,000 persons. The estimated incidence is highest in the youngest age group (0-4 years). This symptomatic incidence of influenza is determined based on information about the number of people visiting the GP with flu-like symptoms, the percentage of these people whose symptoms are actually caused by the influenza virus, and the likelihood of someone with flu-like symptoms visiting the GP. As the number of surveillance sources has expanded and the interpretation of existing surveillance sources has changed (for example, due to changed healthcare-seeking behavior), we are working on calculating the influenza incidence in a different way. For the outcomes on this page, the previously used version is still applied.
Reduced inhibition
Most tested influenza A(H1N1)pdm09 and all influenza A(H3N2) and influenza B/Victoria viruses showed no reduced sensitivity to antiviral drugs such as oseltamivir or baloxavir. This is systematically investigated in a portion of the influenza viruses collected for surveillance.
The influenza viruses are also examined for certain genetic changes (mutations leading to amino acid substitutions) that can result in reduced sensitivity to antiviral drugs. Antiviral drugs are rarely used in the Netherlands, only for people at very high risk of becoming seriously ill from influenza.
Shortly before the start of the respiratory season 2023/2024, an A(H1N1)pdm09 virus with a double amino acid substitution NA-I223V and NA-S247N was detected in the Netherlands for the first time. During the peak in virus detections, the percentage of double-mutant viruses of sequenced A(H1N1)pdm09 was about 10%. From week 40, 2023 to week 28, 2024, a total of 30 (3.4%) double-mutant viruses were found. These viruses showed slightly reduced inhibition by the antiviral oseltamivir. Three other A(H1N1)pdm09 viruses with reduced inhibition by oseltamivir were also found in the surveillance; two viruses with amino acid substitution NA-H275Y and one virus with amino acid substitution NA-I223T.
The NA-H275Y mutants can be considered resistant to oseltamivir and therefore cannot be treated with oseltamivir therapy. For the other found mutants, this is less clear because there is little or no data on the treatment of patients infected with these mutants. However, these mutants will be less effectively inhibited by oseltamivir, which may result in less effective treatment.
Comparison of virus and vaccine
With a few exceptions, the vaccine composition for 2023/2024 matched well with the circulating influenza viruses. Outside the Netherlands, the circulating viruses also corresponded well with the viruses included in the vaccine. As some recent A(H3N2) viruses appear to be changing compared to the current vaccine strain, the recommendation for the A(H3N2) virus vaccine component for the 2024/2025 season has been adjusted.
Of the characterized influenza A(H1N1)pdm09 viruses, about three-quarters belonged to clade 5a.2a and a quarter to clade 5a.2a.1, which also includes the vaccine strain A/Victoria/4897/2022. Of the characterized influenza A(H3N2) viruses, a few belonged to the 2a.3a clade, while the vast majority belonged to the 2a.3a.1 clade. The characterized influenza B (Victoria lineage) viruses all belonged to clade V1A.3a.2.
Effectiveness of the influenza vaccine
In the 2023/2024 winter season, the effectiveness of the influenza vaccine in Europe against influenza A(H1N1)pdm09 infections was 53% (95% confidence interval: 41% to 63%), and against influenza type A(H3N2) infections was 30% (95% confidence interval: -3% to 54%). In the 2023/2024 season, the influenza vaccination is estimated to have prevented over 6,000 GP visits by people aged 65 and older. These interim estimates, from the European VEBIS-study, were made during the winter season. The RIVM, like other European countries, provided data for this study. The estimates are calculated for influenza virus infections in people of all ages who visited the GP with flu-like symptoms and from whom a throat/nose sample was taken. The final vaccine effectiveness based on data from the entire winter season will follow at a later stage. Based on the number of people visiting the GP with influenza and the preliminary estimate of vaccine effectiveness, an estimate was made of the number of GP visits prevented by influenza vaccination. This estimate is made for people aged 65 and older who were vaccinated within the Dutch influenza vaccination program.
| Season | Start week | End week | Duration of epidemic |
|---|---|---|---|
| 2014/2015 | Week 49 2014 | Week 17 2015 | 21 weeks |
| 2015/2016 | Week 1 2016 | Week 11 2016 | 11 weeks |
| 2016/2017 | Week 48 2016 | Week 11 2017 | 16 weeks |
| 2017/2018 | Week 50 2017 | Week 15 2018 | 18 weeks |
| 2018/2019 | Week 50 2018 | Week 11 2019 | 14 weeks |
| 2019/2020 | First wave: week 5 2020 Second wave: week 10 2020
| First wave: week 7 2020 Second wave: week 11 2020
| First wave: 3 weeks Second wave: 2 weeks Total: 5 weeks |
| 2020/2021 | No influenza-epidemic | No influenza-epidemic | No influenza-epidemic |
| 2021/2022 | Week 8 2022 | Week 20 2022 | 13 weeks |
| 2022/2023 | Week 50 2022 | Week 11 2023 | 14 weeks |
| 2023/2024 | Week 3 2024 | Week 11 2024 | 9 weeks |
Figure 1. Percentage of specimens from ILI patients at the GP, positive for influenza virus during the respiratory season
Skip chart 'Figure 1. Percentage of specimens from ILI patients at the GP, positive for influenza virus during the respiratory season (week 40, 2023 to week 20, 2024), per week and the ILI-incidence per 100,000 inhabitants.' and go to datatableFootnote: In this figure, the ILI incidence per 100,000 inhabitants is shown (and not as in most figures per 10,000 inhabitants), to allow a combined display with the number of tested specimens.
Figure 2. Percentage of specimens from ILI patients at the GP, positive for influenza virus per age group
Skip chart 'Figure 2. Percentage of specimens from ILI patients at the GP, positive for influenza virus during the respiratory season (week 40, 2023 to week 20, 2024), per age group.' and go to datatableFigure 5. Weekly number of influenza virus A detections
Skip chart 'Figure 5. Weekly number of influenza virus A detections reported in the virological laboratory surveillance for the respiratory years 2014/2015 to 2022/2023 and for the respiratory season (up to week 20) 2023/2024.' and go to datatableThe black line shows the average number of detections per week for the respiratory years 2014/2015 – 2018/2019, the other lines show the weekly detections of the subsequent respiratory years.
Note: This data is owned by the laboratories participating in virological laboratory surveillance, represented by the board of the Dutch Working Group for Clinical Virology (NWKV). The database management is handled by RIVM. Further use of this data is not allowed without permission. Permission to use this data can be requested by contacting virweekstaten@rivm.nl.
Figure 6. Weekly number of influenza virus B detections
Skip chart 'Figure 6. Weekly number of influenza virus B detections reported in the virological laboratory surveillance for the respiratory years 2014/2015 to 2022/2023 and for the respiratory season (up to week 20) 2023/2024.' and go to datatableThe black line shows the average number of detections per week for the respiratory years 2014/2015 – 2018/2019, the other lines show the weekly detections of the subsequent respiratory years.
Note: This data is owned by the laboratories participating in virological laboratory surveillance, represented by the board of the Dutch Working Group for Clinical Virology (NWKV). The database management is handled by RIVM. Further use of this data is not allowed without permission. Permission to use this data can be requested by contacting virweekstaten@rivm.nl.
Figure 7. Estimated symptomatic influenza (SI) incidence per 10,000 inhabitants within the respiratory season (week 40 to week 20 of the following year), outside the respiratory season (week 21 to week 39), and in the entire respiratory year (week 40 to week 39 of the following year), for the respiratory years 2019/2020 to 2022/2023 and the respiratory season 2023/2024.
(Sources: Nivel Primary Care Database, NIC location RIVM, De Grote Griepmeting (up to 2019/2020), Infectieradar (from 2021/2022)
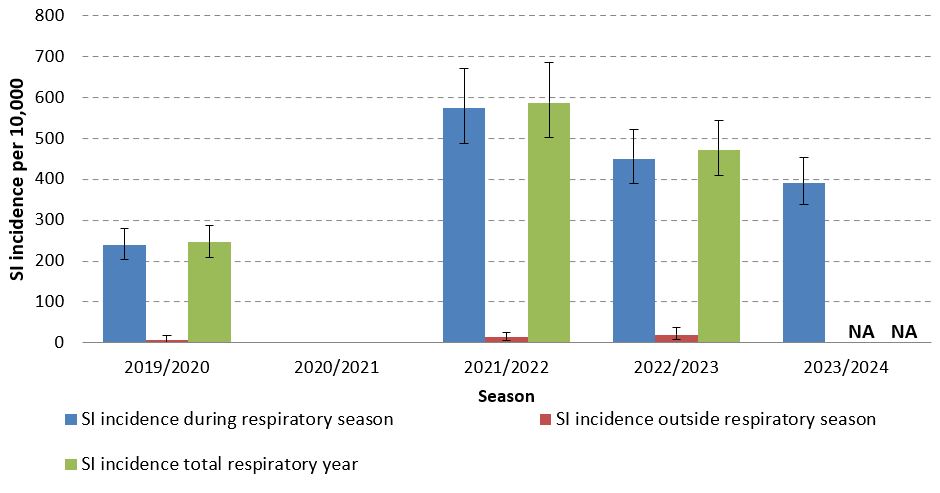
Footnote: Error bars represent 95% uncertainty intervals (UI). For the respiratory season 2023/2024, the data outside the respiratory season (from week 21 to week 39) is not yet available (NA).
Figure 8. Estimated symptomatic influenza (SI) incidence per 10,000 inhabitants by influenza subtype, within the respiratory seasons (week 40 to week 20 of the following year) from 2019/2020 to 2023/2024.
(Sources: Nivel Primary Care Database, NIC location RIVM, De Grote Griepmeting (up to 2019/2020), Infectieradar (from 2021/2022)).

Footnote: SI = symptomatic influenza.
Error bars represent 95% uncertainty intervals (UI)
Figure 9. Estimated symptomatic influenza (SI) incidence per 10,000 inhabitants by age group, within the respiratory seasons (week 40 to week 20 of the following year) from 2019/2020 to 2023/2024.
(Sources: Nivel Primary Care Database, NIC location RIVM, De Grote Griepmeting (up to 2019/2020), Infectieradar (from 2021/2022)).

Footnote: SI = symptomatic influenza.
Error bars represent 95% uncertainty intervals (UI).
Figure 10. Weekly genetic characterization of influenza viruses
Skip chart 'Figure 10. Weekly genetic characterization of influenza viruses, from influenza viruses sent by Dutch laboratories to NIC locations Erasmus MC and RIVM, and from influenza viruses from the Nivel Primary Care Database and Infectieradar, during the respiratory season 2023/2024.' and go to datatable| Used data | |
|---|---|
| Influenza vaccine coverage in people aged 65 and older1 | 66,5 (60,0 – 72,5) |
| Influenza vaccine effectiveness2 | 50,0 (39,2 – 60,9) |
| Number of GP visits for influenza in people aged 65 and older | 12.381 (8.880 – 16.660) |
| Estimated Impact | |
| Number of prevented GP visits for influenza in people aged 65 and older | 6.167 (3.641 – 9.680) |
| Number of prevented GP visits for influenza per 100.000 people aged 65 and older | 168 (99 – 263) |
| Number of vaccinated persons needed to avoid one influenza-associated GP visit | 397 (259 – 654) |
Figure 11. Estimates of prevented GP visits for flu, seasons 2018/2019, 2019/2020, 2022/2023, and 2023/2024 in people aged 65 and older.
(Sources: Nivel Primary Care Database, Nivel Monitor Vaccination Coverage NPG, VEBIS primary care research, and NIC location RIVM).

Blue bars represent the estimated number of observed cases. Orange bars represent the estimated number of cases prevented by the 2023 influenza vaccination campaign, with 95% confidence intervals.
Footnote: Due to the likely changed behavior in visiting the GP during the COVID-19 pandemic, the impact for the seasons 2020/2021 and 2021/2022 was not estimated.