From 2005-2006 the food consumption and intake of energy and nutrients was measured among young children 2 to 6 years of age.
Conclusions and recommendations
Conclusions
The diet of young children in the Netherlands is adequate with regard to the proportions of protein, total fat and carbohydrates contributing to energy intake. The fatty acid composition of the diet could be improved because the intake of saturated fat is too high and consumption of fish (high in n–3 fatty acids) too low. Very few children meet the recommended daily intake of vegetables. While fruit intake comes closer to the recommended level, only about a quarter of the children meet the recommended intake. Intake of dietary fibre is also low.
Based on the current Dutch recommended intake, young children have adequate intake of most vitamins and minerals except for vitamin D and folic acid. The implications of the low intake of these vitamins need to be investigated further. The recommended vitamin D supplement for children aged 1 to 4 years is not always met and thus requires further attention.
The diet of young children in the Netherlands is safe regarding the exposure to fumonisin B1, deoxynivalenol, patulin, nitrate and organophosphorus pesticides present in food. For dioxins, there is a limited probability that an adverse health effect will occur. For acrylamide there is also a probability of an adverse health effect occurring in young children, although the extent to which this could happen is as yet unclear. For aflatoxin B1 and ochratoxin A, it was not feasible to determine whether or not an adverse health effect will occur, due to the use of (partly) targeted concentration data for the last two compounds.
Recommendations
Policy measures to improve the nutrition of young children should be directed to increasing consumption of fruit and vegetables, fish and foods high in dietary fibre, and to improving the fatty acid composition of the diet. Such improvements to the diet of young children will contribute to the prevention of overweight and chronic disease later in life.
For dioxins, but especially for acrylamide, aflatoxin B1, and ochratoxin A, more research is needed to refine the risk assessment. The most important requirements for this purpose are the generation of representative concentration data for aflatoxin B1 and ochratoxin A and a better understanding of the toxicological effect of acrylamide.
Results
Response
Parents/carers of 1,634 children were invited to participate in the study. Data were obtained from 1,279 children (78%) using a questionnaire and two 24-hour food diaries.
Representativity
The 1,279 children are distributed according to age and sex as follows:
313 girls 2 to 3 years old; 327 boys 2 to 3 years old;
312 girls 4 to 6 years old; and 327 boys 4 to 6 years old.
The participants were a representative group of young children in the Netherlands in terms of socio-demographic factors such as region and educational level of the head of household. However, densely populated areas were somewhat underrepresented. To correct for small deviations from the general population, the results were weighted for age, sex, educational level of the head of household, region and degree of urbanisation
Consumption of main food groups
Consumption of various food groups by young children aged 4 to 6 years is presented in the table below. In general, children 4 to 6 years of age ate more than the 2 to 3 year-olds, with the exception of fruit, nuts and some other products. Consumption of dairy products was only higher in the group of older boys. Children 4 to 6 years of age consumed more dairy products than plain milk. With the exception of dairy products including cheese, this age group did not meet the Dutch recommended intakes (in Dutch: Richtlijnen Goede Voedselkeuze of the Netherlands Nutrition Centre) for most food groups.
|
Food groups by EPIC-soft classification |
grams/day |
|---|---|
|
Potatoes and other tubers |
47 |
|
Vegetables |
41 |
|
Legumes |
2 |
|
Fruits en nuts |
125 |
|
Fruits/mixed fruits |
119 |
|
Nuts, seeds, nut spread |
5 |
|
Milk and dairy products |
447 |
|
Milk |
193 |
|
Cheese |
11 |
|
Other dairy products |
244 |
|
Cereals and cereal products |
111 |
|
Pasta, rice, other grains |
14 |
|
Bread, crips bread, rusks |
84 |
|
Breakfast cereals |
5 |
|
Meat and meat products |
50 |
|
Fish and shellfish |
5 |
|
Eggs |
5 |
|
Oils and fat |
13 |
|
Sugar and confectionery (incl. syrups) |
72 |
|
Cakes |
41 |
|
Non-alcoholic beverages |
573 |
|
Condiments and sauces |
10 |
|
Soups, bouillon |
15 |
|
Miscellaneous |
11 |
Consumption of fruit, vegetables and fish
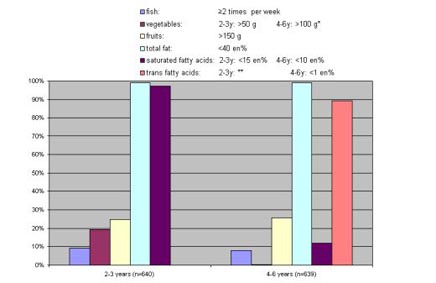
Based on habitual consumption of fruit and vegetables, only about 21 to 30% of children met the recommended fruit intake of >150 g per day. The recommended intake is 50 to 100 g vegetables per day for children aged 1 to 3 years and 100-150 g per day for 4 to 8 year-olds. Only 19% of 2 to 3 year-olds and 0.1% of 4 to 6 year-olds met the lower limit of the recommended intakes and none of the children met the upper bound of the recommendation for vegetables. The recommendation to eat fish twice a week was met by only 9% of children, while 24% never ate fish (based on the answers to the general questionnaire).
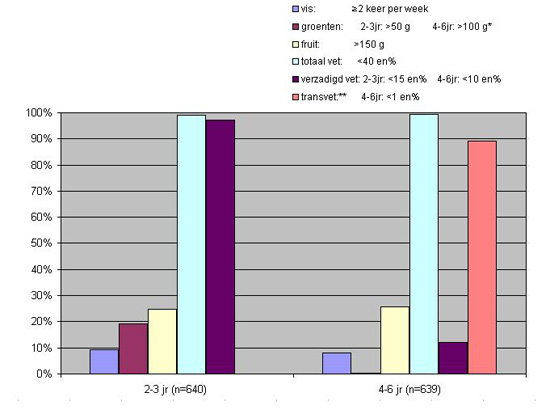
Percentage of children meeting the recommended intake of fruit, vegetables and and fat (n=1,279)
*<0.1% of the 4 tot 6 year-olds meet the recommended intake of vegetables **No comparison with the recommendations for the intake of trans fatty acids can be made for 2 tot 3 year-olds; the recommendation is to consume as little as possible
Intake of energy and macronutrients
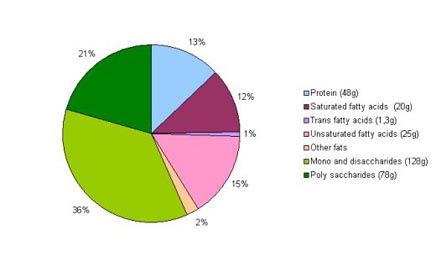
The mean energy intake was 6,196 kJ (1,473 kcal) and was higher in 4 to 6 year-olds than for 2 to 3 year-olds and higher for boys than for girls. The proportion of energy intake (EN%) derived from macronutrient groups is similar for different age groups and in line with recommendations. However, the mean contribution of saturated fatty acids to the fat intake was high. Practically none of the children had a usual total fat intake of max. 40 EN%.
The guideline of max. 10 EN% saturated fatty acids was exceeded by the majority of the 4-6 year old children. For 2-3 year old children this guideline is max. 15 EN% - exceeded by more than 2% of the 2-3 year-olds. The intake of trans fatty acids was for approximately 10% of the 4-6 year old children higher than the recommended max. 1 EN%. For the younger children a guideline for trans-fatty acids is lacking.
Mean energy percentage from macronutrients in the diet of young children aged 2 to 6 years (n=1,279)
Micronutrients
The diet of young children including dietary supplements was adequate in most micronutrients, with the exception of vitamin D and iron (2 to 3 year-olds and girls 4 to 6 year-olds) and folic acid equivalents (4 to 6 year-old). The median (P50) intake was lower than the adequate intake. The median habitual intake of dietary fibre was lower than recommended.
The percentage of children with an intake of copper above the tolerable intake level was overestimated in 2007. Based on new copper values, only a small percentage of children aged 2 to 3 years had an intake of copper above the tolerable intake level (9% of the boys, 7% of the girls).
|
micronutrient |
unit |
2-3 yr-olds (n=640) |
|
|
|
4-6 yr-olds (n=639) |
|
|
|
|---|---|---|---|---|---|---|---|---|---|
|
|
|
P5 |
P50 |
P95 |
Al* |
P5 |
P50 |
P95 |
Al* |
|
Vitamin A |
RAE (µg) |
250 |
565 |
1275 |
400 |
238 |
523 |
1229 |
500 |
|
Vitamin B1 |
mg |
0,5 |
0,8 |
1,4 |
0,3 |
0,5 |
0,9 |
1,5 |
0,5 |
|
Vitamin B2 |
mg |
0,7 |
1,3 |
2,1 |
0,5 |
0,7 |
1,4 |
2,6 |
0,7 |
|
Vitamin B6 |
mg |
0,7 |
1,2 |
2,2 |
0,4 |
0,8 |
1,3 |
2,5 |
0,7 |
|
Foliumzuur |
Foliumz. Equiv.(µg) |
66 |
127 |
338 |
85 |
69 |
135 |
315 |
150 |
|
Vitamin C |
mg |
33 |
69 |
128 |
40 |
33 |
71 |
144 |
45 |
|
Vitamin D |
µg |
1,2 |
4,1 |
9,3 |
5-10-2012 |
1 |
2,4 |
5,6 |
2,5-5 |
|
Calcium |
mg |
447 |
754 |
1145 |
500 |
444 |
793 |
1249 |
700 |
|
Copper |
mg |
0,5 |
0,7 |
1,1 |
0,3-0,7 |
0,5 |
0,8 |
1,2 |
0,5-1,0 |
|
Iron |
mg |
4,1 |
6,4 |
9,7 |
7 |
4,8 |
7,2 |
12,2 |
7 |
|
Fibre |
g/MJ |
1,6 |
2,3 |
3,2 |
2,8 |
1,5 |
2,1 |
2,9 |
3 |
*AI: adequate intake
Supplements and fortified foods
Almost half of the children received a supplement on one of the diet record days. Use of supplements was twice as high in children aged 2 to 3 years (62%) than in children 4 to 6 years of age (30%). The most used supplement was vitamin D in 2 to 3 year-olds, while for 4 to 6 year-olds, this was multivitamins /minerals. Only about 60% of 2 to 3 year-olds take the recommended daily supplement of 5 µg vitamin D per day.
Approximately three-quarters of children consumed fortified foods, mainly fortified beverages, syrups, and dairy products. A high proportion of products in a number of food groups are fortified - more that 90% of soy products, around 60% of breakfast cereals and around half of the syrups and juices, as well as a third of dairy products and one-sixth of yoghurt(drinks).
Contribution of fortified foods and supplements to intake of energy and nutrients (n=1,279)
Food safety
For fumonisin B1, patulin and residues of organophosphorus pesticides (OPs) the exposure did not exceed the relevant health based limit values (HBLVs). For dioxins, deoxynivalenol (DON), ochratoxin A (OTA) and nitrate, HBLVs were exceeded by part of the children. For two compounds, acrylamide and the mycotoxin aflatoxin B1, a margin of exposure was estimated below the value of 10,000. This is the limit value above which the health risk is negligible.
|
Compound (group) |
P99 level of exposure |
Unit of exposure |
% children with exposure > HBLV |
Margin of exposure |
|---|---|---|---|---|
|
Acrylamide |
1,5 |
µg/kg bw/d |
|
200 |
|
Dioxins |
2,3-2,8 |
pg/kg bw/d |
1-3-2014 |
|
|
Mycotoxins |
|
|
|
|
|
Aflatoxin B1 |
2,7 |
ng/kg bw/d |
|
63 |
|
DON |
0,4-0,6 |
µg/kg bw/d |
1-3-2012 |
|
|
Fumonisin B1 |
1 |
µg/kg bw/d |
<1 |
|
|
OTA |
32 |
ng/kg bw/d |
20 |
|
|
Patuline |
0,23 |
µg/kg bw/d |
<1 |
|
|
Nitrate |
|
|
|
|
|
Summer |
3,5-4,7 |
mg/kg bw/d |
1-5-2012 |
|
|
Winter |
2,4-3,6 |
mg/kg bw/d |
0-1 |
|
|
Ops |
27 (p99.9) |
µg/kg bw/d |
<0.1 |
|
Objective
The DNFCS-Young children aims to establish:
- Mean intake of energy and recommended nutrients;
- Mean intake of fruits, vegetables and fish and the percentage of children that meet the recommended intake for these foods;
- Percentage of children taking supplements and intake of nutrients from foods and supplements, including vitamin D and iron.
- Exposure to acrylamide, dioxins, mycotoxines (aflatoxin B1, deoxynivalenol (DON), fumonisin B1, ochratoxin A and patulin), nitrate and residues of organophosphorus pesticides. Mycotoxines are toxic compounds produced by fungi.
Method
Parents/carers are invited in writing to participate in the survey and the parents and children willing to participate are visited at home by an employee of the market research agency. They presented survey materials and gave instructions about the survey. The data are collected by means of a written general questionnaire and two detailed food-intake diaries.
General questionnaire
The questionnaire comprises questions on background information about the child and family, the child’s daily rhythm and activities, general information about the child’s nutrition, specific questions about frequency of use of specific products, use of dietary supplements, purchase of biological products, and use and size of cups and glasses used by the child. Parents were asked to measure the cups and glasses with the provided measuring cup. Different questionnaires have been used for school going children (115Kb) (age 4 years and older, in Dutch) en pre-school going children (113Kb) (2-4 years old, in Dutch).
Height and weight
During the home visit, the child’s weight and length were measured and recorded.
Food diaries
For the aim of the survey, pre-structured dairies have been developed. The parent/carer of the child noted precisely the foods the child has eaten on the two indicated, independent, different days of the week. The period between the registrations was 8-13 days. On each day, a record was made of consumption at different meals and different times. Also, the place of consumption and type of day (ordinary or holiday) was registered. The average time taken to complete the food dairy was 30 minutes. Portion size of the products and meals consumed by the child could be estimated by the parent/carer in different ways: by means of quantities as in the photos in the instruction/photo book, or in domestic measures, standard units, weight or volume.
Carers returned the completed questionnaires and the food diaries to the market research agency. All information was checked for completeness on pre-defined criteria such as food consumption at specific times during the day, food preparation and dietary supplements. The completed diaries were entered by dieticians into the EPIC-Soft computer programme (EPIC-Soft®, IARC).
EPIC-Soft
Information from the food diaries was entered as follows:
- information about the respondent (such as birth date, height, weight) and the day of recall (special diet or eating habit; special day such as national holidays, holidays);
- time and place of each consumption occasion;
- description and quantity of foods recorded in the food diaries; each food was further specified where possible, for instance, on preparation method or fat content;
- intake of vitamin and mineral supplements.
Nutrients
Food composition was based on the Dutch Food Composition Table 2006 and newly available (2009) copper values of chocolate sandwich fillings. Composition of dietary supplements was based on the Dutch Supplement Database, version 2006.
Habitual intake
For correct evaluation of the food intake with regard to nutrition standards, not average intake over two days but the intake over a longer period (habitual intake) is important. The habitual intake was obtained from the measured intake with the Nusser method. The habitual intake presented here is based on analyses carried out in 2009.
Food safety
To estimate the dietary exposure to contaminants and residues of pesticides in young children in the Netherlands, food consumption data were linked to recent monitoring concentration data of these compounds in foods. For this advanced statistical models were used. To assess the possible health risk related to the exposure to these compounds, the exposure per compound was compared to its corresponding health based limit value. For acrylamide and aflatoxin B1, possible carcinogenic compounds, a margin of exposure was derived. If the exposure exceeded the health based limit value or resulted in a relatively low margin of exposure, the available toxicity database was further reviewed with special attention to children to re-assess the risk.
Study population
Age 2-6 years
Information on the nutrition of this age group is obtained from the children’s parents and carers.
1279 young children
The representativeness of the study population was monitored and -if neccesary- the results were adjusted for gender, age (2-3 years and 4-6 years), education of the head of household, place of residence, region and level of urbanisation.
Consumer panel
Respondents were selected from representative consumer panels of the Market Research Agency GfK. Persons in these panels participate in all types of surveys and are not specially selected on the basis of nutrition characteristics. Parents who do not have sufficient knowledge of the Dutch language and institutionalized children were excluded from the survey. Participating parents received an incentive (GfK-collected points) when the complete information was received by GfK, the children received a gift from the GfK-employee perfoming the house visits.
Organisation and implementation
Client
Ministry of Health, Welfare and Sport
Coordination/ implementation
RIVM Centre for Nutrition and Health, RIVM Centre for Substances and Integrated Risk Assessment, TNO Quality of Life, and RIKILT – Institute of Food Safety, WUR
Data collection
Market Research Agency Gfk
Period
October 2005 - November 2006
More information
More information on the methods and results of DNFCS-Young children can be found in the report, detailed results and list of publications.


