Archive COVID-19 weekly figures
27 December 2022 | 16:15
Weekly update on the coronavirus SARS-CoV-2: 27 December 2022
In the Infection Radar survey, the percentage of participants who reported possible symptoms of COVID-19 last week increased compared to the week before that (rising to +7.3%). The number of Infection Radar participants who tested positive for COVID-19 also increased (rising to +1.7%) compared to the week before that. In addition, the number of people who tested positive for COVID-19 reported to the Municipal Public Health Services (GGDs) increased (+14%) last week, and the number of people who were tested for COVID-19 by the GGD also increased (21%). The number of nursing home residents who tested positive for COVID-19 stabilised last week (+4%).
On 13 December 2022, the reproduction number based on reported positive tests was1.04 (0.91 – 1.18). The number of new hospital admissions of patients with SARS-CoV-2 decreased somewhat (-6%) compared to the week before. The number of new ICU admissions of patients with SARS-CoV-2 increased slightly. There were 42 ICU admissions last week, compared to 38 ICU admissions the week before. This may not include all hospital admissions due to a delay in reporting during the Christmas period.
Read more on the page: Weekly coronavirus SARS-CoV-2 figures
27 December 2022
Vaccination figures
22 December 2022 | 15:00
Risk of hospital admission more than 2.5 times lower after repeat vaccination in autumn round
In the period from 3 October 2022 through 14 November 2022, the risk of hospital admission for people over 60 who received the repeat vaccination against COVID-19 in the autumn round was more than 2.5 times lower than for people who did not receive this vaccination, but were eligible to do so. The risk of ICU admission for people over 60 with a repeat vaccination in autumn 2022 was more than 2.5 times lower than for people who had had at least one previous vaccination.
Read more on the webpage: Risk of hospital admission more than 2.5 times lower after repeat vaccination in autumn round
20 December 2022 | 16:00
Vaccination figures for autumn round of COVID-19 repeat vaccination
From 19 September up to and including 18 December 2022, nearly 4 million repeat vaccinations against COVID-19 were administered. Vaccination coverage for the repeat vaccination among people over 60 has now reached 58.1%.
Read more in the weekly update on COVID-19 vaccination figures.
20 December 2022 | 15:00
Weekly update on the coronavirus SARS-CoV-2: 20 December 2022
In the Infection Radar survey, the percentage of participants who reported possible symptoms of COVID-19 last week increased compared to the week before that (rising to +6.0%). The number of Infection Radar participants who tested positive for COVID-19 also increased (rising to +1.4%) compared to the week before that. The number of people who tested positive for COVID-19 reported to the Municipal Public Health Services (GGDs) stabilised (+2%). The number of people who were tested for COVID-19 by the GGD decreased slightly last week (-6.0%). The number of nursing home residents who tested positive for COVID-19 continued to increase last week (+14%).
On 6 December 2022, the reproduction number based on reported positive tests was 0.94 (0.82 – 1.07). The number of new hospital admissions of patients with SARS-CoV-2 increased somewhat (+9%) compared to the week before. The number of new ICU admissions of patients with SARS-CoV-2 increased. There were 38 ICU admissions last week (+46%), compared to 26ICU admissions the week before.
Read more on the page: Weekly coronavirus SARS-CoV-2 figures
22 December 2022 | 15:00
Risk of hospital admission more than 2.5 times lower after repeat vaccination in autumn round
In the period from 3 October 2022 through 14 November 2022, the risk of hospital admission for people over 60 who received the repeat vaccination against COVID-19 in the autumn round was more than 2.5 times lower than for people who did not receive this vaccination, but were eligible to do so. The risk of ICU admission for people over 60 with a repeat vaccination in autumn 2022 was more than 2.5 times lower than for people who had had at least one previous vaccination.
Read more on the webpage: Risk of hospital admission more than 2.5 times lower after repeat vaccination in autumn round
13 December 2022 | 16:00
Vaccination figures for autumn round of COVID-19 repeat vaccination
From 19 September up to and including 11 December 2022, more than 3.9 million repeat vaccinations against COVID-19 were administered. Vaccination coverage for the repeat vaccination among people over 60 has now reached 57.6%.
Read more in the weekly update on COVID-19 vaccination figures.
13 December 2022 | 17:00
Weekly update on the coronavirus SARS-CoV-2: 13 December 2022
As of 16 September 2022, the Coronavirus Dashboard provided by the national government also includes the coronavirus thermometer. The thermometer offers a visual representation of pressure on society and healthcare as a result of the coronavirus SARS-CoV-2. The coronavirus thermometer is based on the epidemiological situation and the associated RIVM analysis.
The RIVM Response Team advises coronavirus thermometer: status 1 – low (Limited pressure on healthcare chain and society)
Infection Radar, testing, and hospital and ICU admissions
In the Infection Radar survey, the percentage of participants who reported possible symptoms of COVID-19 last week increased compared to the week before that (rising to +5.6%). The number of Infection Radar participants who tested positive for COVID-19 increased very slightly (rising to +1.1%) compared to the week before that. The number of people who tested positive for COVID-19 reported to the Municipal Public Health Services (GGDs) increased slightly (+7%). The number of people who were tested for COVID-19 by the GGD stabilised last week (-4%). The number of nursing home residents who tested positive for COVID-19 increased significantly last week (+51%).
On 29 November 2022, the reproduction number based on reported positive tests was The number of new hospital admissions of patients with SARS-CoV-2 increased (+16%) compared to the week before. The number of new ICU admissions of patients with SARS-CoV-2 increased slightly. There were 26 ICU admissions last week (+8%), compared to 24 ICU admissions the week before.
Sewage surveillance
In week 48 (28 November - 4 December 2022), sewage surveillance showed that the national average viral load was about the same as last week (+3%). In that week, the highest figures were seen in the regions of Amsterdam-Amstelland and Haaglanden. In the first half of week 49 (5 – 7 December), the average viral load continued to increase, rising by +12%. Viral loads were highest in Gelderland-Zuid. Once again, the Omicron BA.5 variant and its sub-variants were detected most frequently in sewage surveillance: mainly BQ.1. More recombinants (variants that combine properties of multiple SARS-CoV-2 variants) and Omicron BA.2 sub-variants were also detected, particularly BA.2.75 and its sub-variants.
Virus variants from pathogen surveillance
Since early 2022, RIVM has mainly observed many different sub-variants that belong to the Omicron family in the context of pathogen surveillance. Mutations are also emerging within these sub-variants. The same pattern is occurring in other countries as well.
Since June 2022, BA.5 has been responsible for the highest number of infections in the Netherlands. An increase in BA.4.6, BA.2.75 and BF.7 had already been observed. More recently, the percentage of sub-variant BQ.1, including BQ.1.1, has been growing. Recombinant XBB (a variant that combines properties of various Omicron sub-variants) is also increasing. At this time, there are no indications that these sub-variants would be more likely to cause severe illness compared to previous Omicron sub-variants.
The latest calculations suggest that BQ.1 may soon become dominant in the Netherlands. These estimates always have some margin of uncertainty. It is also possible that multiple variants, including BQ.1 and XBB, will continue circulating at the same time. New variants or sub-variants may also emerge.
| Reports of people tested for SARS-CoV-2 who had a positive test result | 6 December to 13 December1,2 | 29 November to 6 December3,4 |
| Number of newly reported positive tests (by date as published by RIVM) |
5,810 (31 per 100,000 inhabitants) |
5,432 (29 per 100,000 inhabitants) |
| Hospital admissions by calendar week | Week 491 | Week 482 |
|
Total new hospital admissions of patients with SARS-COV-2 (including ICU admissions) New hospital admissions of patients with SARS-CoV-2 (including ICU admissions) not including patients with an admission reason other than SARS-CoV-2 (Source: NICE)5 |
382
334 |
330
274 |
|
Total new ICU admissions of patients with SARS-CoV-2 New ICU admissions not including patients with an admission reason other than SARS-CoV-2 (Source: NICE)5 |
26 21 |
24 21 |
| Infection Radar by calendar week | Week 491 | Week 482 |
|
The percentage of Infection Radar survey participants with symptoms that could indicate COVID-196 The percentage of Infection Radar survey participants who had a positive test result7 |
5.6%
|
5.3%
|
| Reported deaths of people who tested positive for SARS-CoV-2 8 | 6 December to 13 December1,2 | 29 November to 6 December3,4 |
| Deaths | 13 | 17 |
| SARS-CoV-2 tests by the GGD per calendar week | week 499 | week 489 |
| Total number of tests of which results are known Number of positive tests Percentage of positive tests* |
6,924 |
7,176 |
| Latest calculation | One week before | |
| Reproduction numbers10 | On 29 November 2022 | On 22 November 2022 |
| Based on reported positive tests | 0.97 (0.83 – 1.12) | 0.98 (0.83 – 1.13) |
| Based on hospital admissions (Source: NICE)11 | 1.00 (0.72 – 1.31) | 0.96 (0.68 – 1.28) |
| Based on ICU admissions (Source: NICE)11 | 0.97 (0.00 – 2.71) | 1.03 (0.00 – 2.71) |
| Last week (first half of the week) | Two weeks ago (first and second half of the week) | |
| Sewage surveillance | Week 49 (5 t/m 7 December 2022) | Week 48 (28 November to 4 December 2022) |
| Average number of virus particles (x 100 billion per 100,000 inhabitants)12 | 1187 | 1063 |
| Number of sampling locations on which the average is based | 294/31113 | 306/31114 |
| Number of people connected to those sewage treatment plants15 |
16,723,644 |
17,172,019 |
1 As published 13 December 2022 in the weekly epidemiological update on SARS-CoV-2 in the Netherlands.
2 Reports by the Municipal Public Health Services (GGDs) to RIVM between 6 December 2022 10:01 and 13 December 2022 10:00.
3As published 6 December 2022 in the weekly epidemiological update on SARS-CoV-2 in the Netherlands.
4 Reports by the Municipal Public Health Services (GGDs) to RIVM between 29 November 2022 10:01 and 6 December 2022 10:00.
5Not all patients admitted to hospital with the coronavirus SARS-CoV-2 have COVID-19 as the main reason or one of the reasons for hospital admission. The hospital and ICU admissions for which it is known that admission was due to other reasons than a SARS-CoV-2 infection (category 3 in the admission reasons) are not counted here. For an explanation of the categories of admission reasons, see the RIVM graphs page, or the weekly epidemiological update on SARS-CoV-2 in the Netherlands.
6 The number of unique survey participants reporting symptoms that could indicate COVID-19 per day who filled out a survey questionnaire, summed up for the entire calendar week (Monday through Sunday). This number is divided by the number of unique participants per day who filled out a survey questionnaire.
7The number of unique survey participants reporting a positive COVID-19 test per day, summed up for the entire calendar week (Monday through Sunday). The positive test result could come from a self-test, a PCR test or a rapid antigen test. These results are not from the nose and throat swabs sent in through the self-test study that started in September 2022.
8 Not all of these reported deaths occurred within the last week. The actual number of deaths is higher than the deaths that are reported in the surveillance. This is because there is no mandatory reporting requirement for death due to COVID-19. For that reason, the mortality figures presented here are underreported.
9 As published 13 December 2022 in the weekly epidemiological update on SARS-CoV-2 in the Netherlands. The figures from the past week and current week may be updated to include any test results provided later. These figures only include tests of people who were tested in the GGD test lanes and does not include any tests that are required in order to travel.
10 For more information about the reproduction number, click here.
11 The reproduction numbers (R) based on NICE data are calculated using hospital and ICU admissions due to COVID-19. These calculations do not include admissions registered by NICE after 25 January 2022 for any reason other than COVID-19.
12 Based on data available at RIVM on Monday afternoon, 12 December 2022, as published in the open data. See the sewage surveillance updates on the Coronavirus Dashboard for the latest figures. See the explanation of the data presented for more details about how these figures are calculated.
13 In the first half of last week, between 1 and 3 samples were taken from each sampling location and analysed. The samples were taken on the Monday, Tuesday and/or Wednesday of that week.
14 Ideally, a total of 4 sewage samples from all 311 sampling locations would be taken and analysed in order to calculate the average for the previous week.
15 Number of people connected to the number of sampling locations on which the average is based.
06 December 2022 | 16:20
Vaccination figures for autumn round of COVID-19 repeat vaccination
From 19 September up to and including 4 December 2022, more than 3.8 million repeat vaccinations against COVID-19 were administered. Vaccination coverage for the repeat vaccination among people over 60 has now reached 57.3%.
Read more in the weekly update on COVID-19 vaccination figures.
6 December 2022 | 16:15
Weekly update on the coronavirus SARS-CoV-2: 6 December 2022
As of 16 September 2022, the Coronavirus Dashboard provided by the national government also includes the coronavirus thermometer. The thermometer offers a visual representation of pressure on society and healthcare as a result of the coronavirus SARS-CoV-2. The coronavirus thermometer is based on the epidemiological situation and the associated RIVM analysis.
The RIVM Response Team advises coronavirus thermometer: status 1 – low (Limited pressure on healthcare chain and society)
Infection Radar, testing, and hospital and ICU admissions
In the Infection Radar survey, the percentage of participants who reported possible symptoms of COVID-19 last week increased compared to the week before that (+5.3%). The number of Infection Radar participants who tested positive for COVID-19 remained stable (+1%) compared to the week before that. The number of people who tested positive for COVID-19 reported to the Municipal Public Health Services (GGDs) increased slightly (+5%). The number of people who were tested for COVID-19 by the GGD stabilised last week (-1%). The number of nursing home residents who tested positive for COVID-19 increased last week (+19%).
On 22 November 2022, the reproduction number based on reported positive tests was 0.98 (0.83 – 1.13). The number of new hospital admissions of patients with SARS-CoV-2 was stable (+2%) compared to the week before. The number of new ICU admissions of patients with SARS-CoV-2 decreased. There were 24 ICU admissions last week (-20%), compared to 30 ICU admissions the week before.
Sewage surveillance
In week 47 (21 – 27 November 2022), sewage surveillance showed that the national average viral load increased slightly, rising by 4.7%. In that week, the highest figures were seen in the Kennemerland region. In the first half of week 48 (28 November – 1 December), the average viral load increased slightly, rising by 4.7%. Viral loads were highest in Limburg-Zuid and Amsterdam-Amstelland. Once again, the Omicron BA.5 variant and its sub-variants were detected most frequently in sewage surveillance: mainly BQ.1. More recombinants (variants that combine properties of multiple SARS-CoV-2 variants) and Omicron BA.2 sub-variants were also detected, particularly BA.2.75 and its sub-variants.
Virus variants from pathogen surveillance
Since early 2022, RIVM has mainly observed many different sub-variants that belong to the Omicron family, specifically sub-variants BA.1 through BA.5, in the context of pathogen surveillance. Mutations are also emerging within these sub-variants. The same pattern is occurring in other countries as well.
Since June 2022, BA.5 has been responsible for the highest number of infections in the Netherlands. An increase in BA.4.6, BA.2.75 and BF.7 had already been observed. More recently, the percentage of sub-variant BQ.1, including BQ.1.1, has been growing. Recombinant XBB (a variant that combines properties of various Omicron sub-variants) is also increasing. At this time, there are no indications that these sub-variants would be more likely to cause severe illness compared to previous Omicron sub-variants.
The latest calculations suggest that BQ.1 may soon become dominant in the Netherlands. These estimates always have some margin of uncertainty. It is also possible that multiple variants, including BQ.1 and XBB, will continue circulating at the same time. New variants or sub-variants may also emerge.
| Reports of people tested for SARS-CoV-2 who had a positive test result | 29 November to 6 December1,2 | 22 November to 29 November3,4 |
| Number of newly reported positive tests (by date as published by RIVM) |
5,432 (29 per 100,000 inhabitants) |
5,155 (28 per 100,000 inhabitants) |
| Hospital admissions by calendar week | Week 481 | Week 472 |
|
Total new hospital admissions of patients with SARS-COV-2 (including ICU admissions) New hospital admissions of patients with SARS-CoV-2 (including ICU admissions) not including patients with an admission reason other than SARS-CoV-2 (Source: NICE)5 |
330
274 |
324
270 |
|
Total new ICU admissions of patients with SARS-CoV-2 New ICU admissions not including patients with an admission reason other than SARS-CoV-2 (Source: NICE)5 |
24 21 |
30 22 |
| Infection Radar by calendar week | Week 481 | Week 472 |
|
The percentage of Infection Radar survey participants with symptoms that could indicate COVID-196 The percentage of Infection Radar survey participants who had a positive test result7 |
5.3%
|
4.3%
|
| Reported deaths of people who tested positive for SARS-CoV-2 8 | 29 November to 6 December1,2 | 22 November to 29 November3,4 |
| Deaths | 17 | 9 |
| SARS-CoV-2 tests by the GGD per calendar week | week 489 | week 479 |
| Total number of tests of which results are known Number of positive tests Percentage of positive tests* |
7,177 |
7,092 |
| Latest calculation | One week before | |
| Reproduction numbers10 | On 22 November 2022 | On 15 November 2022 |
| Based on reported positive tests | 0.98 (0.83 – 1.13) | 0.92 (0.79 – 1.06) |
| Based on hospital admissions (Source: NICE)11 | 0.96 (0.68 – 1.28) | 0.96 (0.66 – 1.30) |
| Based on ICU admissions (Source: NICE)11 | 1.03 (0.00 – 2.71) | 1.17 (0.00 – 3.01) |
| Last week (first half of the week) | Two weeks ago (first and second half of the week) | |
| Sewage surveillance | Week 48 (28 to 30 November 2022) | Week 47 (21 to 27 November 2022) |
| Average number of virus particles (x 100 billion per 100,000 inhabitants)12 | 1076 | 1028 |
| Number of sampling locations on which the average is based | 302/31113 | 306/31114 |
| Number of people connected to those sewage treatment plants15 |
16,955,498 |
16,548,674 |
1 As published 6 December 2022 in the weekly epidemiological update on SARS-CoV-2 in the Netherlands.
2 Reports by the Municipal Public Health Services (GGDs) to RIVM between 29 November 2022 10:01 and 6 December 2022 10:00.
3As published 29 November 2022 in the weekly epidemiological update on SARS-CoV-2 in the Netherlands.
4 Reports by the Municipal Public Health Services (GGDs) to RIVM between 22 November 2022 10:01 and 29 November 2022 10:00.
5Not all patients admitted to hospital with the coronavirus SARS-CoV-2 have COVID-19 as the main reason or one of the reasons for hospital admission. The hospital and ICU admissions for which it is known that admission was due to other reasons than a SARS-CoV-2 infection (category 3 in the admission reasons) are not counted here. For an explanation of the categories of admission reasons, see the RIVM graphs page, or the weekly epidemiological update on SARS-CoV-2 in the Netherlands.
6 The number of unique survey participants reporting symptoms that could indicate COVID-19 per day who filled out a survey questionnaire, summed up for the entire calendar week (Monday through Sunday). This number is divided by the number of unique participants per day who filled out a survey questionnaire.
7The number of unique survey participants reporting a positive COVID-19 test per day, summed up for the entire calendar week (Monday through Sunday). The positive test result could come from a self-test, a PCR test or a rapid antigen test. These results are not from the nose and throat swabs sent in through the self-test study that started in September 2022.
8 Not all of these reported deaths occurred within the last week. The actual number of deaths is higher than the deaths that are reported in the surveillance. This is because there is no mandatory reporting requirement for death due to COVID-19. For that reason, the mortality figures presented here are underreported.
9 As published 6 December 2022 in the weekly epidemiological update on SARS-CoV-2 in the Netherlands. The figures from the past week and current week may be updated to include any test results provided later. These figures only include tests of people who were tested in the GGD test lanes and does not include any tests that are required in order to travel.
10 For more information about the reproduction number, click here.
11 The reproduction numbers (R) based on NICE data are calculated using hospital and ICU admissions due to COVID-19. These calculations do not include admissions registered by NICE after 25 January 2022 for any reason other than COVID-19.
12 Based on data available at RIVM on Monday afternoon, 5 December 2022, as published in the open data. See the sewage surveillance updates on the Coronavirus Dashboard for the latest figures. See the explanation of the data presented for more details about how these figures are calculated.
13 In the first half of last week, between 1 and 3 samples were taken from each sampling location and analysed. The samples were taken on the Monday, Tuesday and/or Wednesday of that week.
14 Ideally, a total of 4 sewage samples from all 311 sampling locations would be taken and analysed in order to calculate the average for the previous week.
15 Number of people connected to the number of sampling locations on which the average is based.
02 December 2022 | 17:00
Ministry follows Health Council advice: COVID-19 vaccination also available for children aged 6 months to 4 years with serious medical conditions
Vaccination against COVID-19 will also be available for children aged 6 months through 4 years who have serious medical conditions, according to the statement made by Ernst Kuipers, Minister of Health, Welfare and Sport, to the House of Representatives of the Netherlands today. An estimated 5000 children aged 6 months to 4 years who have serious medical conditions are at higher risk of serious illness resulting from COVID-19, compared to other children the same age. Examples include certain disorders that affect the heart or lungs. In this decision, the Ministry of Health, Welfare and Sport (VWS) is following the advisory report of the Health Council (in Dutch), which is based on recent EMA guidance.
See the press release (in Dutch) for more details
Read more on the page COVID-19 vaccination for children aged 6 months to 4 years with serious medical conditions
29 November 2022 | 16:00
Vaccination figures for autumn round of COVID-19 repeat vaccination
From 19 September up to and including 27 November 2022, more than 3.8 million repeat vaccinations against COVID-19 were administered. Vaccination coverage for the repeat vaccination among people over 60 has now reached 56.6%.
Read more in the weekly update on COVID-19 vaccination figures.
29 November 2022 | 15:00
Weekly update on the coronavirus SARS-CoV-2: 29 November 2022
As of 16 September 2022, the Coronavirus Dashboard provided by the national government also includes the coronavirus thermometer. The thermometer offers a visual representation of pressure on society and healthcare as a result of the coronavirus SARS-CoV-2. The coronavirus thermometer is based on the epidemiological situation and the associated RIVM analysis.
The RIVM Response Team advises coronavirus thermometer: status 1 – low (Limited pressure on healthcare chain and society)
Infection Radar, testing, and hospital and ICU admissions
In the Infection Radar survey, the percentage of participants who reported possible symptoms of COVID-19 last week remained stable compared to the week before that (+4.3%). The number of Infection Radar participants who tested positive for COVID-19 increased slightly compared to the previous week, rising from +0.9% to +1.0%. The number of people who tested positive for COVID-19 reported to the Municipal Public Health Services (GGDs) decreased slightly (-5%). The number of people who were tested for COVID-19 by the GGD also decreased somewhat last week (-12%). The number of nursing home residents who tested positive for COVID-19 increased somewhat last week (+13%).
On 15 November 2022, the reproduction number based on reported positive tests was 0.92 (0.79 – 1.06). The number of new hospital admissions of patients with SARS-CoV-2 increased slightly (+8%) compared to the week before. The number of new ICU admissions of patients with SARS-CoV-2 also increased. There were 30 ICU admissions last week (+67%), compared to 18 ICU admissions the week before.
Sewage surveillance
In week 46 (14 - 20 November 2022), sewage surveillance showed that the national average viral load increased by 28%. Viral loads were highest in Limburg-Zuid and Amsterdam-Amstelland. In the first half of week 47 (21 – 23 November), the average viral load continued to decrease slightly (at least for now), dropping 8%. Viral loads were highest in Kennemerland and Limburg-Zuid. Once again, the Omicron BA.5 variant and its sub-variants were detected most frequently in sewage surveillance: mainly BF.7 and BQ.1. More recombinants and BA.2 variants were also detected, particularly sub-variants of BA.2.75.
Virus variants from pathogen surveillance
Since early 2022, RIVM has mainly observed many different sub-variants that belong to the Omicron family, specifically sub-variants BA.1 through BA.5, in the context of pathogen surveillance. Mutations are also emerging within these sub-variants. The same pattern is occurring in other countries as well.
Since June 2022, BA.5 has been responsible for the highest number of infections in the Netherlands. An increase in BA.4.6, BA.2.75 and BF.7 had already been observed over the past few weeks. More recently, the percentage of sub-variant BQ.1, including BQ.1.1, has been growing significantly. A recombinant (a variant that combines properties of various Omicron sub-variants) named XBB is also increasing. At this time, there are no indications that these sub-variants would be more likely to cause severe illness compared to previous Omicron sub-variants.
The latest calculations suggest that BQ.1 may soon become dominant in the Netherlands. These estimates always have some margin of uncertainty. It is also possible that multiple variants, including BQ.1 and XBB, will continue circulating at the same time. New variants or sub-variants may also emerge.
| Reports of people tested for SARS-CoV-2 who had a positive test result | 22 November to 29 November1,2 | 15 November to 22 November3,4 |
| Number of newly reported positive tests (by date as published by RIVM) |
5,155 (28 per 100,000 inhabitants) |
5,417 (29 per 100,000 inhabitants) |
| Hospital admissions by calendar week | Week 471 | Week 462 |
|
Total new hospital admissions of patients with SARS-COV-2 (including ICU admissions) New hospital admissions of patients with SARS-CoV-2 (including ICU admissions) not including patients with an admission reason other than SARS-CoV-2 (Source: NICE)5 |
324
270 |
300
254 |
|
Total new ICU admissions of patients with SARS-CoV-2 New ICU admissions not including patients with an admission reason other than SARS-CoV-2 (Source: NICE)5 |
30 22 |
18 13 |
| Infection Radar by calendar week | Week 471 | Week 462 |
|
The percentage of Infection Radar survey participants with symptoms that could indicate COVID-196 The percentage of Infection Radar survey participants who had a positive test result7 |
4.3%
|
4.2%
|
| Reported deaths of people who tested positive for SARS-CoV-2 8 | 22 November to 29 November1,2 | 15 November to 22 November3,4 |
| Deaths | 9 | 15 |
| SARS-CoV-2 tests by the GGD per calendar week | week 479 | week 469 |
| Total number of tests of which results are known Number of positive tests Percentage of positive tests* |
7,092 |
8,042 |
| Latest calculation | One week before | |
| Reproduction numbers10 | On 15 November 2022 | On 8 November 2022 |
| Based on reported positive tests | 0.92 (0.79 – 1.06) | 0.87 (0.74 – 1.00) |
| Based on hospital admissions (Source: NICE)11 | 0.96 (0.66 – 1.30) | 0.90 (0.62 – 1.21) |
| Based on ICU admissions (Source: NICE)11 | 1.17 (0.00 – 3.01) | 1.01 (0.00 – 2.71) |
| Last week (first half of the week) | Two weeks ago (first and second half of the week) | |
| Sewage surveillance | Week 47 (21 to 23 November 2022) | Week 46 (14 to 20 November 2022) |
| Average number of virus particles (x 100 billion per 100,000 inhabitants)12 | 904 | 979 |
| Number of sampling locations on which the average is based | 289/31113 | 306/31114 |
| Number of people connected to those sewage treatment plants15 |
15,725,167 |
17,051,158 |
1 As published 29 November 2022 in the weekly epidemiological update on SARS-CoV-2 in the Netherlands.
2 Reports by the Municipal Public Health Services (GGDs) to RIVM between 22 November 2022 10:01 and 29 November 2022 10:00.
3As published 22 November 2022 in the weekly epidemiological update on SARS-CoV-2 in the Netherlands.
4 Reports by the Municipal Public Health Services (GGDs) to RIVM between 15 November 2022 10:01 and 22 November 2022 10:00.
5Not all patients admitted to hospital with the coronavirus SARS-CoV-2 have COVID-19 as the main reason or one of the reasons for hospital admission. The hospital and ICU admissions for which it is known that admission was due to other reasons than a SARS-CoV-2 infection (category 3 in the admission reasons) are not counted here. For an explanation of the categories of admission reasons, see the RIVM graphs page, or the weekly epidemiological update on SARS-CoV-2 in the Netherlands.
6 The number of unique survey participants reporting symptoms that could indicate COVID-19 per day who filled out a survey questionnaire, summed up for the entire calendar week (Monday through Sunday). This number is divided by the number of unique participants per day who filled out a survey questionnaire.
7The number of unique survey participants reporting a positive COVID-19 test per day, summed up for the entire calendar week (Monday through Sunday). The positive test result could come from a self-test, a PCR test or a rapid antigen test. These results are not from the nose and throat swabs sent in through the self-test study that started in September 2022.
8 Not all of these reported deaths occurred within the last week. The actual number of deaths is higher than the deaths that are reported in the surveillance. This is because there is no mandatory reporting requirement for death due to COVID-19. For that reason, the mortality figures presented here are underreported.
9 As published 29 November 2022 in the weekly epidemiological update on SARS-CoV-2 in the Netherlands. The figures from the past week and current week may be updated to include any test results provided later. These figures only include tests of people who were tested in the GGD test lanes and does not include any tests that are required in order to travel.
10 For more information about the reproduction number, click here.
11 The reproduction numbers (R) based on NICE data are calculated using hospital and ICU admissions due to COVID-19. These calculations do not include admissions registered by NICE after 25 January 2022 for any reason other than COVID-19.
12 Based on data available at RIVM on Monday afternoon, 28 November 2022, as published in the open data. See the sewage surveillance updates on the Coronavirus Dashboard for the latest figures. See the explanation of the data presented for more details about how these figures are calculated.
13 In the first half of last week, between 1 and 3 samples were taken from each sampling location and analysed. The samples were taken on the Monday, Tuesday and/or Wednesday of that week.
14 Ideally, a total of 4 sewage samples from all 311 sampling locations would be taken and analysed in order to calculate the average for the previous week.
15 Number of people connected to the number of sampling locations on which the average is based.
24 November 2022 | 13:00
Report: COVID-19 vaccination coverage in the Netherlands in 2021
RIVM has published a report on COVID-19 vaccination coverage in the Netherlands in 2021 (Dutch report, English synopsis). The report offers an overview of the methods and data sources that RIVM used to assess how many people in the Netherlands were vaccinated against COVID-19 in 2021. It explains which data was available and when, and how RIVM used the data to provide updates about vaccination coverage.
The vaccination campaign against COVID-19 in the Netherlands started on 6 January 2021. Since 19 January 2021, RIVM has been publishing national and regional figures on COVID-19 vaccination on a weekly basis. RIVM also shares data with the European Centre for Disease Prevention and Control (ECDC). This makes it possible to monitor vaccination coverage in the European Union. In addition, the Ministry of Health, Welfare and Sport (VWS) published data on the Coronavirus Dashboard provided by the national government of the Netherlands.
22 November 2022 | 16:40
Vaccination figures for autumn round of COVID-19 repeat vaccination
From 19 September up to and including 20 November 2022, more than 2.7 million repeat vaccinations against COVID-19 were administered. Vaccination coverage for the repeat vaccination among people over 60 has now reached 55.5%.
Read more in the weekly update on COVID-19 vaccination figures.
22 November 2022 | 16:30
Repeat vaccination in autumn 2022: risk of hospital and ICU admission nearly 3 times lower for over-60s
In the period from 3 October 2022 through 14 November 2022, the risk of hospital admission for people over 60 who received the repeat vaccination against COVID-19 in the autumn round was more than 2.5 times lower than for people who did not receive this vaccination, but were eligible to do so. The risk of ICU admission for people over 60 with a repeat vaccination in autumn 2022 was more than 2.5 times lower than for people who had had at least one previous vaccination.
Read more on the webpage Repeat vaccination in autumn 2022: risk of hospital and ICU admission nearly 3 times lower for over-60s
22 November 2022 | 16:25
Weekly update on the coronavirus SARS-CoV-2: 22 November 2022
As of 16 September 2022, the Coronavirus Dashboard provided by the national government also includes the coronavirus thermometer. The thermometer offers a visual representation of pressure on society and healthcare as a result of the coronavirus SARS-CoV-2. The coronavirus thermometer is based on the epidemiological situation and the associated RIVM analysis.
The RIVM Response Team advises coronavirus thermometer: status 1 – low (Limited pressure on healthcare chain and society)
Infection Radar, testing, and hospital and ICU admissions
In the Infection Radar survey, the percentage of participants who reported possible symptoms of COVID-19 last week increased slightly compared to the week before that, rising from +3.8% to +4.2%. The number of Infection Radar participants who tested positive for COVID-19 decreased slightly (-11%) compared to the week before that, as did the number of people with a positive test result reported to the Municipal Public Health Services (GGDs) (-11%). The number of people who were tested for COVID-19 by the GGD also decreased slightly (-10%). The number of nursing home residents who tested positive for COVID-19 stabilised last week.
On 8 November 2022, the reproduction number based on reported positive tests was 0.87 (0.74 – 1.00). The number of new hospital admissions of patients with SARS-CoV-2 decreased slightly (-11%) compared to the week before. The number of new ICU admissions of patients with SARS-CoV-2 also decreased. There were 18 ICU admissions last week (-18%), compared to 22 ICU admissions the week before.
Sewage surveillance
In week 45 (7 - 13 November 2022), sewage surveillance showed that the national average viral load decreased by 30%. In that week, the highest figures were seen in the greater Amsterdam area. In the first half of week 46 (14 – 16 November), the average number of virus particles increased, rising by +25%. Sewage surveillance figures were still highest in and around Amsterdam, but the biggest increases were seen in the south of the Netherlands. Once again, the Omicron BA.5 variant and its sub-variants were detected most frequently in sewage surveillance: mainly BF.7 and a growing percentage of BQ.1.
Virus variants from pathogen surveillance
Since early 2022, RIVM has mainly observed many different sub-variants that belong to the Omicron family, specifically sub-variants BA.1 through BA.5, in the context of pathogen surveillance. Since June 2022, BA.5 has been responsible for the highest number of infections. Mutations are also emerging within these sub-variants. The same pattern is occurring in other countries as well.
An increase in BA.4.6, BA.2.75 and BF.7 had already been observed over the past few weeks. More recently, the percentage of sub-variant BQ.1, including BQ.1.1, has been growing significantly. Recombinant XBB is also increasing. At this time, there are no indications that these sub-variants would be more likely to cause severe illness compared to previous Omicron sub-variants.
The latest calculations suggest that BQ.1 may soon become dominant in the Netherlands. These estimates always have some margin of uncertainty. It is also possible that multiple variants, including BQ.1 and XBB, will continue circulating at the same time. New variants or sub-variants may also emerge.
| Reports of people tested for SARS-CoV-2 who had a positive test result | 15 November to 22 November1,2 | 8 November to 15 November3,4 |
| Number of newly reported positive tests (by date as published by RIVM) |
5,417 (29 per 100,000 inhabitants) |
6,077 (32 per 100,000 inhabitants) |
| Hospital admissions by calendar week | Week 461 | Week 452 |
|
Total new hospital admissions of patients with SARS-COV-2 (including ICU admissions) New hospital admissions of patients with SARS-CoV-2 (including ICU admissions) not including patients with an admission reason other than SARS-CoV-2 (Source: NICE)5 |
300
254 |
337
286 |
|
Total new ICU admissions of patients with SARS-CoV-2 New ICU admissions not including patients with an admission reason other than SARS-CoV-2 (Source: NICE)5 |
18 13 |
22 17 |
| Infection Radar by calendar week | Week 461 | Week 452 |
|
The percentage of Infection Radar survey participants with symptoms that could indicate COVID-196 The percentage of Infection Radar survey participants who had a positive test result7 |
4.2%
|
3.8%
|
| Reported deaths of people who tested positive for SARS-CoV-2 8 | 15 November to 22 November1,2 | 8 November to 15 November3,4 |
| Deaths | 15 | 29 |
| SARS-CoV-2 tests by the GGD per calendar week | week 469 | week 459 |
| Total number of tests of which results are known Number of positive tests Percentage of positive tests* |
8,043 |
8,933 |
| Latest calculation | One week before | |
| Reproduction numbers10 | On 8 November 2022 | On 1 November 2022 |
| Based on reported positive tests | 0.87 (0.74 – 1.00) | 0.79 (0.69 – 0.89) |
| Based on hospital admissions (Source: NICE)11 | 0.90 (0.62 – 1.21) | 0.89 (0.63 – 1.18) |
| Based on ICU admissions (Source: NICE)11 | 1.01 (0.00 – 2,71) | 0.89 (0,00 – 2.17) |
| Last week (first half of the week) | Two weeks ago (first and second half of the week) | |
| Sewage surveillance | Week 46 (14 to 16 November 2022) | Week 45 (7 to 13 November 2022) |
| Average number of virus particles (x 100 billion per 100,000 inhabitants)12 | 953 | 764 |
| Number of sampling locations on which the average is based | 286/31113 | 306/31114 |
| Number of people connected to those sewage treatment plants15 |
15,838,596 |
16,432,121 |
1 As published 22 November 2022 in the weekly epidemiological update on SARS-CoV-2 in the Netherlands.
2 Reports by the Municipal Public Health Services (GGDs) to RIVM between 15 November 2022 10:01 and 22 November 2022 10:00.
3As published 15 November 2022 in the weekly epidemiological update on SARS-CoV-2 in the Netherlands.
4 Reports by the Municipal Public Health Services (GGDs) to RIVM between 8 November 2022 10:01 and 15 November 2022 10:00.
5Not all patients admitted to hospital with the coronavirus SARS-CoV-2 have COVID-19 as the main reason or one of the reasons for hospital admission. The hospital and ICU admissions for which it is known that admission was due to other reasons than a SARS-CoV-2 infection (category 3 in the admission reasons) are not counted here. For an explanation of the categories of admission reasons, see the RIVM graphs page, or the weekly epidemiological update on SARS-CoV-2 in the Netherlands.
6 The number of unique survey participants reporting symptoms that could indicate COVID-19 per day who filled out a survey questionnaire, summed up for the entire calendar week (Monday through Sunday). This number is divided by the number of unique participants per day who filled out a survey questionnaire.
7The number of unique survey participants reporting a positive COVID-19 test per day, summed up for the entire calendar week (Monday through Sunday). The positive test result could come from a self-test, a PCR test or a rapid antigen test. These results are not from the nose and throat swabs sent in through the self-test study that started in September 2022.
8 Not all of these reported deaths occurred within the last week. The actual number of deaths is higher than the deaths that are reported in the surveillance. This is because there is no mandatory reporting requirement for death due to COVID-19. For that reason, the mortality figures presented here are underreported.
9 As published 22 November 2022 in the weekly epidemiological update on SARS-CoV-2 in the Netherlands. The figures from the past week and current week may be updated to include any test results provided later. These figures only include tests of people who were tested in the GGD test lanes and does not include any tests that are required in order to travel.
10 For more information about the reproduction number, click here.
11 The reproduction numbers (R) based on NICE data are calculated using hospital and ICU admissions due to COVID-19. These calculations do not include admissions registered by NICE after 25 January 2022 for any reason other than COVID-19.
12 Based on data available at RIVM on Monday afternoon, 21 November 2022, as published in the open data. See the sewage surveillance updates on the Coronavirus Dashboard for the latest figures. See the explanation of the data presented for more details about how these figures are calculated.
13 In the first half of last week, between 1 and 3 samples were taken from each sampling location and analysed. The samples were taken on the Monday, Tuesday and/or Wednesday of that week.
14 Ideally, a total of 4 sewage samples from all 311 sampling locations would be taken and analysed in order to calculate the average for the previous week.
15 Number of people connected to the number of sampling locations on which the average is based.
21 November 2022 | 17:45
Statistics Netherlands gives researchers access to RIVM vaccination data
RIVM will be sharing the COVID-19 vaccination data with Statistics Netherlands (CBS). Statistics Netherlands will then give external researchers access to the data, under stringent conditions. The Ministry of Health, Welfare and Sport (VWS) reached this decision after receiving legal advice from the State Advocate of the Netherlands. This is stated in a letter sent to the House of Representatives of the Netherlands.
Statistics Netherlands has the statutory authority to request this data from RIVM. After RIVM receives the request, RIVM will provide the data to Statistics Netherlands in a secure manner. The aim is to have completed the process of providing access to the data before the end of 2022.
RIVM considers it important that the vaccination data can be used for research on excess mortality in the Netherlands during the COVID-19 pandemic. Providing access to data is essential for this purpose. Until now, RIVM has not shared the data with Statistics Netherlands (CBS) because it was unclear whether this was appropriate within the regulatory and legislative framework. This was related to the informed consent that was used for people to give permission to share their vaccination data with RIVM.
15 November 2022 | 16:00
Vaccination figures for autumn round of COVID-19 repeat vaccination
From 19 September up to and including 15 November 2022, 3.6 million repeat vaccinations against COVID-19 were administered. Vaccination coverage for the repeat vaccination among people over 60 has now reached 54.2%.
Read more in the weekly update on COVID-19 vaccination figures.
15 November 2022 | 16:00
Weekly update on the coronavirus SARS-CoV-2: 15 November 2022
As of 16 September 2022, the Coronavirus Dashboard provided by the national government also includes the coronavirus thermometer. The thermometer offers a visual representation of pressure on society and healthcare as a result of the coronavirus SARS-CoV-2. The coronavirus thermometer is based on the epidemiological situation and the associated RIVM analysis.
The RIVM Response Team advises coronavirus thermometer: status 2 – increased (Limited pressure on healthcare chain and society, but increased risks are expected for vulnerable groups)
Infection Radar, testing, and hospital and ICU admissions
In the Infection Radar survey, the percentage of participants who reported possible symptoms of COVID-19 last week decreased slightly compared to the week before that, dropping from +4.0% to +3.8%. The number of people who tested positive for COVID-19 (SARS-CoV-2) reported to the Municipal Public Health Services (GGDs) decreased (-21%) last week compared to the week before that. The number of people who were tested for COVID-19 by the GGD also decreased (-24%). The number of nursing home residents who tested positive for COVID-19 decreased by 35% last week.
On 1 November 2022, the reproduction number based on reported positive tests was 0.79 (0.69 – 0.89). The number of new hospital admissions of patients with SARS-CoV-2 decreased (-21%) compared to the week before. The number of new ICU admissions of patients with SARS-CoV-2 also decreased. There were 22 ICU admissions last week (-33%), compared to 33 ICU admissions the week before.
Sewage surveillance
In week 43 (24-30 October 2022), sewage surveillance showed that the national average viral load decreased by 15%. In that week, the highest figures were seen in the regions of Zeeland and Haaglanden. In the first half of week 45 (7 – 9 November), the average number of virus particles continued to decrease, dropping by 31%. In the Amsterdam-Amstelland region, sewage surveillance figures rose significantly in the first half of week 45, reaching a high level compared to the rest of the Netherlands. Once again, the Omicron BA.5 variant and its sub-variants were detected most frequently: BF.7 is often observed, but BQ.1 has been increasingly rapidly in recent weeks.
Virus variants from pathogen surveillance
Since early 2022, RIVM has mainly observed many different sub-variants that belong to the Omicron family, specifically sub-variants BA.1 through BA.5, in the context of pathogen surveillance. Mutations are also emerging within these sub-variants. The same pattern is occurring in other countries as well.
An increase in BA.4.6, BA.2.75 and BF.7 had already been observed over the past few weeks. More recently, the percentage of sub-variant BQ.1, including BQ.1.1, has been growing significantly. Recombinant XBB has also been detected. At this time, there are no indications that these sub-variants would be more likely to cause severe illness compared to previous Omicron sub-variants.
The latest calculations suggest that BQ.1 may soon become dominant in the Netherlands. These estimates always have some margin of uncertainty. It is also possible that multiple variants, including BQ.1, will continue circulating at the same time. New variants or sub-variants may also emerge.
| Reports of people tested for SARS-CoV-2 who had a positive test result | 8 November to 15 November1,2 | 1 November to 8 November3,4 |
| Number of newly reported positive tests (by date as published by RIVM) |
6.077 (32 per 100,000 inhabitants) |
7.719 (41 per 100,000 inhabitants) |
| Hospital admissions by calendar week | Week 451 | Week 442 |
|
Total new hospital admissions of patients with SARS-COV-2 (including ICU admissions) New hospital admissions of patients with SARS-CoV-2 (including ICU admissions) not including patients with an admission reason other than SARS-CoV-2 (Source: NICE)5 |
337
286 |
426
341 |
|
Total new ICU admissions of patients with SARS-CoV-2 New ICU admissions not including patients with an admission reason other than SARS-CoV-2 (Source: NICE)5 |
22 17 |
33 23 |
| Infection Radar by calendar week | Week 451 | Week 442 |
|
The percentage of Infection Radar survey participants with symptoms that could indicate COVID-196 The percentage of Infection Radar survey participants who had a positive test result7 |
3.8%
|
4.0%
|
| Reported deaths of people who tested positive for SARS-CoV-2 8 | 8 November to 16 November1,2 | 1 November to 8 November3,4 |
| Deaths | 29 | 29 |
| SARS-CoV-2 tests by the GGD per calendar week | week 459 | week 449 |
| Total number of tests of which results are known Number of positive tests Percentage of positive tests* |
8,933 |
11,801 |
| Latest calculation | One week before | |
| Reproduction numbers10 | On 1 November 2022 | On 25 October 2022 |
| Based on reported positive tests | 0,79 (0,69 – 0,89) | 0,79 (0,71 – 0,88) |
| Based on hospital admissions (Source: NICE)11 | 0,89 (0,63 – 1,18) | 0,86 (0,63 – 1,11) |
| Based on ICU admissions (Source: NICE)11 | 0,89 (0,00 – 2,71) | 0,90 (0,00 – 2,17) |
| Last week (first half of the week) | Two weeks ago (first and second half of the week) | |
| Sewage surveillance | Week 45 (7 to 9 November 2022) | Week 44 (31 October to 6 November 2022) |
| Average number of virus particles (x 100 billion per 100,000 inhabitants)12 | 746 | 1088 |
| Number of sampling locations on which the average is based | 282/31113 | 306/31114 |
| Number of people connected to those sewage treatment plants15 |
15,470,330 |
17,016,102 |
1 As published 15 November 2022 in the weekly epidemiological update on SARS-CoV-2 in the Netherlands.
2 Reports by the Municipal Public Health Services (GGDs) to RIVM between 8 November 2022 10:01 and 15 November 2022 10:00.
3As published 8 November 2022 in the weekly epidemiological update on SARS-CoV-2 in the Netherlands.
4 Reports by the Municipal Public Health Services (GGDs) to RIVM between 1 November 2022 10:01 and 8 November 2022 10:00.
5Not all patients admitted to hospital with the coronavirus SARS-CoV-2 have COVID-19 as the main reason or one of the reasons for hospital admission. The hospital and ICU admissions for which it is known that admission was due to other reasons than a SARS-CoV-2 infection (category 3 in the admission reasons) are not counted here. For an explanation of the categories of admission reasons, see the RIVM graphs page, or the weekly epidemiological update on SARS-CoV-2 in the Netherlands.
6 The number of unique survey participants reporting symptoms that could indicate COVID-19 per day who filled out a survey questionnaire, summed up for the entire calendar week (Monday through Sunday). This number is divided by the number of unique participants per day who filled out a survey questionnaire.
7The number of unique survey participants reporting a positive COVID-19 test per day, summed up for the entire calendar week (Monday through Sunday). The positive test result could come from a self-test, a PCR test or a rapid antigen test. These results are not from the nose and throat swabs sent in through the self-test study that started in September 2022.
8 Not all of these reported deaths occurred within the last week. The actual number of deaths is higher than the deaths that are reported in the surveillance. This is because there is no mandatory reporting requirement for death due to COVID-19. For that reason, the mortality figures presented here are underreported.
9 As published 15 November 2022 in the weekly epidemiological update on SARS-CoV-2 in the Netherlands. The figures from the past week and current week may be updated to include any test results provided later. These figures only include tests of people who were tested in the GGD test lanes and does not include any tests that are required in order to travel.
10 For more information about the reproduction number, click here.
11 The reproduction numbers (R) based on NICE data are calculated using hospital and ICU admissions due to COVID-19. These calculations do not include admissions registered by NICE after 25 January 2022 for any reason other than COVID-19.
12 Based on data available at RIVM on Monday afternoon, 14 November 2022, as published in the open data. See the sewage surveillance updates on the Coronavirus Dashboard for the latest figures. See the explanation of the data presented for more details about how these figures are calculated.
13 In the first half of last week, between 1 and 3 samples were taken from each sampling location and analysed. The samples were taken on the Monday, Tuesday and/or Wednesday of that week.
14 Ideally, a total of 4 sewage samples from all 311 sampling locations would be taken and analysed in order to calculate the average for the previous week.
15 Number of people connected to the number of sampling locations on which the average is based.
8 November 2022 | 16:00
Risk of hospital admission nearly 3 times lower for over-60s with repeat vaccination in autumn 2022
In the period from 3 October 2022 through 2 November 2022, the risk of hospital admission for people over 60 who received the repeat vaccination against COVID-19 in the autumn round was about 2.7 times lower than for people who did not receive this vaccination, but were eligible to do so. The risk of ICU admission for people over 60 with a repeat vaccination in autumn 2022 was more than 2 times lower than for people who had had at least one previous vaccination.
Read more on the webpage Risk of hospital admission nearly 3 times lower for over-60s with repeat vaccination in autumn 2022
8 November 2022 | 16:00
Vaccination figures for autumn round of COVID-19 repeat vaccination
From 19 September up to and including 6 November 2022, 3.4 million repeat vaccinations against COVID-19 were administered. Vaccination coverage for the repeat vaccination among people over 60 has now reached 52.1%.
Read more in the weekly update on COVID-19 vaccination figures.
8 November 2022 | 15:00
Weekly update on the coronavirus SARS-CoV-2: 8 November 2022
As of 16 September 2022, the Coronavirus Dashboard provided by the national government also includes the coronavirus thermometer. The thermometer offers a visual representation of pressure on society and healthcare as a result of the coronavirus SARS-CoV-2. The coronavirus thermometer is based on the epidemiological situation and the associated RIVM analysis.
The RIVM Response Team advises coronavirus thermometer: status 2 – increased (Limited pressure on healthcare chain and society, but increased risks are expected for vulnerable groups)
Infection Radar, testing, and hospital and ICU admissions
In the Infection Radar survey, the percentage of people who reported possible symptoms of COVID-19 last week decreased compared to the week before that, dropping from +4.4% to +4.0%. The number of people who tested positive for COVID-19 (SARS-CoV-2) reported to the Municipal Public Health Services (GGDs) decreased (-37%) last week compared to the week before that. The number of people who were tested for COVID-19 by the GGD also decreased (-30%). The number of nursing home residents who tested positive for COVID-19 decreased by 34% last week.
On 25 October 2022, the reproduction number based on reported positive tests was 0.79 (0.71 – 0.88). The number of new hospital admissions of patients with SARS-CoV-2 decreased (-26%) compared to the week before. The number of new ICU admissions of patients with SARS-CoV-2also decreased. There were 33 ICU admissions last week (-38%), compared to 53 ICU admissions the week before.
Sewage surveillance
In week 43 (24-30 October 2022), sewage surveillance showed that the national average viral load decreased by 27%, continuing to decrease by 26% in the first half of week 44 (31 October – 2 November). The highest figures were seen in Gooi- en Vechtstreek (week 43) and Zeeland (week 44), and figures were also high in Haaglanden in both weeks. Once again, the Omicron BA.5 variant and its sub-variants were detected most frequently, still including a high percentage of BF.7, but with a significant increase in BQ.1 in recent weeks.
Virus variants from pathogen surveillance
Since early 2022, RIVM has mainly observed many different sub-variants that belong to the Omicron family, specifically sub-variants BA.1 through BA.5, in the context of pathogen surveillance. But mutations are also emerging within these sub-variants. The same pattern is occurring in other countries as well.
Omicron BA.2 was initially dominant in the Netherlands, followed by BA.2; since June 2022, BA.5 has been responsible for the highest number of infections. By now, there are multiple sub-variants of BA.2, BA.4 and BA.5 that are being monitored more closely. From BA.2, we are seeing sub-variants BA.2.75 and BA.2.12.1. From BA.4, we are seeing sub-variant BA.4.6. And sub-variants of BA.5 include BF.7 and BQ.1 (as well as BQ.1.1). RIVM is also monitoring recombinant strains of variants, such as XBB, which combine characteristics of other variants.
An increase in BA.4.6, BA.2.75 and BF.7 had already been observed over the past few weeks. More recently, the percentage of sub-variant BQ.1, including BQ.1.1, has been growing significantly. Recombinant XBB has only been observed a few times so far. At this time, there are no indications that these sub-variants would be more likely to cause severe illness compared to previous Omicron sub-variants.
The latest calculations suggest that BQ.1 (including BQ.1.1) may become dominant in the Netherlands during this month. These estimates always have some margin of uncertainty. It is also possible that multiple variants, including BQ.1, will continue circulating at the same time. New variants or sub-variants may also emerge.
| Reports of people tested for SARS-CoV-2 who had a positive test result | 1 November to 8 November1,2 | 25 October to 1 November3,4 |
| Number of newly reported positive tests (by date as published by RIVM) |
7,719 (41 per 100,000 inhabitants) |
12,311 (66 per 100,000 inhabitants) |
| Hospital admissions by calendar week | Week 441 | Week 432 |
|
Total new hospital admissions of patients with SARS-COV-2 (including ICU admissions) New hospital admissions of patients with SARS-CoV-2 (including ICU admissions) not including patients with an admission reason other than SARS-CoV-2 (Source: NICE)5 |
426
341 |
572
469 |
|
Total new ICU admissions of patients with SARS-CoV-2 New ICU admissions not including patients with an admission reason other than SARS-CoV-2 (Source: NICE)5 |
33 23 |
53 36 |
| Infection Radar by calendar week | Week 441 | Week 432 |
|
The percentage of Infection Radar survey participants with symptoms that could indicate COVID-196 The percentage of Infection Radar survey participants who had a positive test result7 |
4.0%
|
4.4%
|
| Reported deaths of people who tested positive for SARS-CoV-2 8 | 1 November to 8 November1,2 | 25 October to 1 November3,4 |
| Deaths | 29 | 38 |
| SARS-CoV-2 tests by the GGD per calendar week | week 449 | week 439 |
| Total number of tests of which results are known Number of positive tests Percentage of positive tests* |
11,801 |
16,935 |
| Latest calculation | One week before | |
| Reproduction numbers10 | On 25 October 2022 | On 18 October 2022 |
| Based on reported positive tests | 0.79 (0.71 – 0.88) | 0.82 (0.75 – 0.89) |
| Based on hospital admissions (Source: NICE)11 | 0.86 (0.63 – 1.11) | 0.89 (0.69 – 1.10) |
| Based on ICU admissions (Source: NICE)11 | 1.90 (0.00 – 2.17) | 1.02 (0,15 – 2.17) |
| Last week (first half of the week) | Two weeks ago (first and second half of the week) | |
| Sewage surveillance | Week 44 (31 October to 2 November 2022) | Week 43 (24 to 30 October 2022) |
| Average number of virus particles (x 100 billion per 100,000 inhabitants)12 | 946 | 1275 |
| Number of sampling locations on which the average is based | 293/31113 | 308/31114 |
| Number of people connected to those sewage treatment plants15 |
16,682,422 |
17,259,043 |
1 As published 8 November 2022 in the weekly epidemiological update on SARS-CoV-2 in the Netherlands.
2 Reports by the Municipal Public Health Services (GGDs) to RIVM between 8 November 2022 10:01 and 8 November 2022 10:00.
3As published 8 November 2022 in the weekly epidemiological update on SARS-CoV-2 in the Netherlands.
4 Reports by the Municipal Public Health Services (GGDs) to RIVM between 25 October 2022 10:01 and 8 November 2022 10:00.
5Not all patients admitted to hospital with the coronavirus SARS-CoV-2 have COVID-19 as the main reason or one of the reasons for hospital admission. The hospital and ICU admissions for which it is known that admission was due to other reasons than a SARS-CoV-2 infection (category 3 in the admission reasons) are not counted here. For an explanation of the categories of admission reasons, see the RIVM graphs page, or the weekly epidemiological update on SARS-CoV-2 in the Netherlands.
6 The number of unique survey participants reporting symptoms that could indicate COVID-19 per day who filled out a survey questionnaire, summed up for the entire calendar week (Monday through Sunday). This number is divided by the number of unique participants per day who filled out a survey questionnaire.
7The number of unique survey participants reporting a positive COVID-19 test per day, summed up for the entire calendar week (Monday through Sunday). The positive test result could come from a self-test, a PCR test or a rapid antigen test. These results are not from the nose and throat swabs sent in through the self-test study that started in September 2022.
8 Not all of these reported deaths occurred within the last week. The actual number of deaths is higher than the deaths that are reported in the surveillance. This is because there is no mandatory reporting requirement for death due to COVID-19. For that reason, the mortality figures presented here are underreported.
9 As published 8 November 2022 in the weekly epidemiological update on SARS-CoV-2 in the Netherlands. The figures from the past week and current week may be updated to include any test results provided later. These figures only include tests of people who were tested in the GGD test lanes and does not include any tests that are required in order to travel.
10 For more information about the reproduction number, click here.
11 The reproduction numbers (R) based on NICE data are calculated using hospital and ICU admissions due to COVID-19. These calculations do not include admissions registered by NICE after 25 January 2022 for any reason other than COVID-19.
12 Based on data available at RIVM on Monday afternoon, 7 November 2022, as published in the open data. See the sewage surveillance updates on the Coronavirus Dashboard for the latest figures. See the explanation of the data presented for more details about how these figures are calculated.
13 In the first half of last week, between 1 and 3 samples were taken from each sampling location and analysed. The samples were taken on the Monday, Tuesday and/or Wednesday of that week.
14 Ideally, a total of 4 sewage samples from all 311 sampling locations would be taken and analysed in order to calculate the average for the previous week.
15 Number of people connected to the number of sampling locations on which the average is based.
1 November 2022 | 16:30
Vaccination figures for autumn round of COVID-19 repeat vaccination
From 19 September up to and including 30 October 2022, more than 3 million repeat vaccinations against COVID-19 were administered. Vaccination coverage for the repeat vaccination among people over 60 has now reached 48.7%.
The repeat vaccination is available to everyone aged 12 years and older who has completed the basic series of COVID-19 vaccinations. The first invitations were sent to people aged 60 years and older or turning 60 this year, people in medical risk groups, and care workers who have contact with patients or clients. People can get the repeat vaccination starting from 3 months after their last COVID-19 vaccination or 3 months after a SARS-CoV-2 infection.
Read more in the weekly update on COVID-19 vaccination figures.
1 November 2022 | 15:30
Weekly update on the coronavirus SARS-CoV-2: 1 November 2022
As of 16 September 2022, the Coronavirus Dashboard provided by the national government also includes the coronavirus thermometer. The thermometer offers a visual representation of pressure on society and healthcare as a result of the coronavirus SARS-CoV-2. The coronavirus thermometer is based on the epidemiological situation and the associated RIVM analysis.
The RIVM Response Team advises coronavirus thermometer: status 2 – increased (Limited pressure on healthcare chain and society, but increased risks are expected for vulnerable groups)
Infection Radar, testing, and hospital and ICU admissions
In the Infection Radar survey,the percentage of people who reported possible symptoms of COVID-19 last week decreased (+4.4%) compared to the week before that (+5.0%). The number of people who tested positive for COVID-19 (SARS-CoV-2) reported to the Municipal Public Health Services (GGDs) decreased (-30%) last week compared to the week before that. The number of people who were tested for COVID-19 by the GGD also decreased (-27%). The number of nursing home residents who tested positive for COVID-19 decreased by 40% last week.
On 18 October 2022, the reproduction number based on reported positive tests was 0.82 (0.75 – 0.89). The number of new hospital admissions of patients with SARS-CoV-2 decreased (-21%) compared to the week before. The number of new ICU admissions of patients with SARS-CoV-2 remained stable. There were 53 ICU admissions last week (+4%), compared to 51 ICU admissions the week before.
Sewage surveillance
In week 42 (17-23 October 2022), sewage surveillance showed that the national average viral load increased by 8%, decreasing by 17% in the first half of week 43 (24 – 26 October). In these weeks, the highest figures were seen in Haaglanden and in Gooi- en Vechtstreek. The Omicron BA.5 variant and its sub-variants were still detected most frequently in sewage surveillance, including a high percentage of BF.7 and a growing percentage of BQ.1. BA.4 sub-variants also continue to be observed.
Virus variants from pathogen surveillance
RIVM has observed various Omicron sub-variants in pathogen surveillance. Since June 2022, BA.5 has been the dominant variant in the Netherlands.
Various sub-variants of BA.2, BA.4 and BA.5 are now present and under monitoring. This includes BA.2.75 and BA.2.12.1, BA.4.6, and various BA.5 sub-variants, such as BF.7, BQ.1 and BQ.1.1. Recombinant strains of variants, such as XBB, are also being monitored.
An increase in BA.4.6, BA.2.75 and BF.7 has been observed over the past few weeks. The percentage of sub-variant BQ.1, including BQ.1.1, is now also growing. Recombinant XBB has only been observed a few times so far.
Trend forecasts for various sub-variants based on the latest pathogen surveillance data show that BQ.1 may become dominant before the end of this year. However, these forecasts are still uncertain. It is also possible that multiple variants, including BQ.1, will continue circulating at the same time. These variants are being monitored and the trend forecasts are updated weekly based on new data from pathogen surveillance.
The sub-variants seem to have minor specific mutations in the spike protein that enable them to more easily evade the immunity built up against SARS-CoV-2 (by vaccination or previous infection). It is still too early to assess how much the new sub-variants will lead to a further increase in the number of SARS-CoV-2 infections, separate from any increase due to the seasonal effect.
| Reports of people tested for SARS-CoV-2 who had a positive test result | 25 October to 1 November1,2 | 18 October to 25 October3,4 |
| Number of newly reported positive tests (by date as published by RIVM) |
12,311 (66 per 100,000 inhabitants) |
17,623 (94 per 100,000 inhabitants) |
| Hospital admissions by calendar week | Week 431 | Week 423 |
|
Total new hospital admissions of patients with SARS-COV-2 (including ICU admissions) New hospital admissions of patients with SARS-CoV-2 (including ICU admissions) not including patients with an admission reason other than SARS-CoV-2 (Source: NICE)5 |
572
469 |
721
603 |
|
Total new ICU admissions of patients with SARS-CoV-2 New ICU admissions not including patients with an admission reason other than SARS-CoV-2 (Source: NICE)5 |
53 36 |
51 39 |
| Infection Radar by calendar week | Week 431 | Week 422 |
|
The percentage of Infection Radar survey participants with symptoms that could indicate COVID-196 The percentage of Infection Radar survey participants who had a positive test result7 |
4.4%
|
5.0%
|
| Reported deaths of people who tested positive for SARS-CoV-2 8 | 25 October to 1 November1,2 | 18 October to 25 October3,4 |
| Deaths | 38 | 35 |
| SARS-CoV-2 tests by the GGD per calendar week | week 439 | week 429 |
| Total number of tests of which results are known Number of positive tests Percentage of positive tests* |
16,935 |
23,192 |
| Latest calculation | One week before | |
| Reproduction numbers10 | On 18 October 2022 | On 11 October 2022 |
| Based on reported positive tests | 0,82 (0,75 – 0,89) | 0,91 (0,85 – 0,97) |
| Based on hospital admissions (Source: NICE)11 | 0,89 (0,69 – 1,10) | 0,95 (0,76 – 1,15) |
| Based on ICU admissions (Source: NICE)11 | 1,02 (0,15 – 2,17) | 1,03 (0,23 – 2,11) |
| Last week (first half of the week) | Two weeks ago (first and second half of the week) | |
| Sewage surveillance | Week 43 (24 to 26 October 2022) | Week 42 (17 to 23 October 2022) |
| Average number of virus particles (x 100 billion per 100,000 inhabitants)12 | 1433 | 1726 |
| Number of sampling locations on which the average is based | 297/31113 | 309/31114 |
| Number of people connected to those sewage treatment plants15 |
16,744,745 |
17,254,236 |
1 As published 1 November 2022 in the weekly epidemiological update on SARS-CoV-2 in the Netherlands.
2 Reports by the Municipal Public Health Services (GGDs) to RIVM between 25 October 2022 10:01 and 1 November 2022 10:00.
3As published 25 October 2022 in the weekly epidemiological update on SARS-CoV-2 in the Netherlands.
4 Reports by the Municipal Public Health Services (GGDs) to RIVM between 18 October 2022 10:01 and 25 October 2022 10:00.
5Not all patients admitted to hospital with the coronavirus SARS-CoV-2 have COVID-19 as the main reason or one of the reasons for hospital admission. The hospital and ICU admissions for which it is known that admission was due to other reasons than a SARS-CoV-2 infection (category 3 in the admission reasons) are not counted here. For an explanation of the categories of admission reasons, see the RIVM graphs page, or the weekly epidemiological update on SARS-CoV-2 in the Netherlands.
6 The number of unique survey participants reporting symptoms that could indicate COVID-19 per day who filled out a survey questionnaire, summed up for the entire calendar week (Monday through Sunday). This number is divided by the number of unique participants per day who filled out a survey questionnaire.
7The number of unique survey participants reporting a positive COVID-19 test per day, summed up for the entire calendar week (Monday through Sunday). The positive test result could come from a self-test, a PCR test or a rapid antigen test. These results are not from the nose and throat swabs sent in through the self-test study that started in September 2022.
8 Not all of these reported deaths occurred within the last week. The actual number of deaths is higher than the deaths that are reported in the surveillance. This is because there is no mandatory reporting requirement for death due to COVID-19. For that reason, the mortality figures presented here are underreported.
9 As published 1 November 2022 in the weekly epidemiological update on SARS-CoV-2 in the Netherlands. The figures from the past week and current week may be updated to include any test results provided later. These figures only include tests of people who were tested in the GGD test lanes and does not include any tests that are required in order to travel.
10 For more information about the reproduction number, click here.
11 The reproduction numbers (R) based on NICE data are calculated using hospital and ICU admissions due to COVID-19. These calculations do not include admissions registered by NICE after 25 January 2022 for any reason other than COVID-19.
12 Based on data available at RIVM on Monday afternoon, 31 October 2022, as published in the open data. See the sewage surveillance updates on the Coronavirus Dashboard for the latest figures. See the explanation of the data presented for more details about how these figures are calculated.
13 In the first half of last week, between 1 and 3 samples were taken from each sampling location and analysed. The samples were taken on the Monday, Tuesday and/or Wednesday of that week.
14 Ideally, a total of 4 sewage samples from all 311 sampling locations would be taken and analysed in order to calculate the average for the previous week.
15 Number of people connected to the number of sampling locations on which the average is based.
25 October 2022 | 16:00
Vaccination figures for autumn round of COVID-19 repeat vaccination
From 19 September to 23 October 2022, nearly 2.5 million repeat vaccinations against COVID-19 were administered. Last week, similar to the week before, most of the repeat vaccinations administered were in the age group of 60 years and older. Vaccination coverage for the repeat vaccination among people over 60 has now reached 42.4%.
Read more in the weekly update on COVID-19 vaccination figures.
25 October 2022 | 15:55
Weekly update on the coronavirus SARS-CoV-2: 25 October 2022
As of 16 September 2022, the Coronavirus Dashboard provided by the national government also includes the coronavirus thermometer. The thermometer offers a visual representation of pressure on society and healthcare as a result of the coronavirus SARS-CoV-2. The coronavirus thermometer is based on the epidemiological situation and the associated RIVM analysis.
The RIVM Response Team advises coronavirus thermometer: status 2 – increased (Limited pressure on healthcare chain and society, but increased risks are expected for vulnerable groups)
Infection Radar, testing, and hospital and ICU admissions
In the Infection Radar survey, the percentage of people who reported possible symptoms of COVID-19 last week decreased slightly (+5.0%) compared to the week before that (+5.4%). The number of people who tested positive for COVID-19 (SARS-CoV-2) reported to the Municipal Public Health Services (GGDs) decreased (-22%) last week compared to the week before that. The number of people who were tested for COVID-19 by the GGD also decreased (-19%). The number of nursing home residents who tested positive for COVID-19 decreased by 21% last week.
On 11 October 2022, the reproduction number based on reported positive tests was 0.91 (0.85 – 0.97). The number of new hospital admissions of patients with SARS-CoV-2 increased slightly (+6%) compared to the week before. The number of new ICU admissions of patients with SARS-CoV-2 increased slightly. There were 51 ICU admissions last week (+6%), compared to 48 ICU admissions the week before.
Sewage surveillance
In week 41 (10-16 October 2022), sewage surveillance showed that the national average viral load decreased by 8%, rising by 7% in the first half of week 42 (17 – 19 October). In both weeks, the highest figures were seen in Amsterdam and the surrounding area. The Omicron BA.5 variant and all its sub-variants were still detected most frequently in sewage surveillance, including a high percentage of BF.7 and a growing percentage of BQ.1. BA.4 also continues to be observed.
Virus variants from pathogen surveillance
RIVM has observed various Omicron sub-variants in pathogen surveillance. Since June 2022, BA.5 has been the dominant variant in the Netherlands.
Various sub-variants of BA.2, BA.4 and BA.5 are now present and under monitoring. This includes BA.2.75 and BA.2.12.1, BA.4.6, and various BA.5 sub-variants, such as BF.7, BQ.1 and BQ.1.1. Recombinant strains of variants, such as XBB, are also being monitored.
Following an initial increase in the Omicron sub-variants BA.2.75 and BA.4.6, BF.7 has been slowly increasing in pathogen surveillance in recent weeks. The percentages of sub-variants BQ.1 and BQ.1.1 are now also growing, although the numbers remain limited for now. Variant XBB has only been observed a few times so far.
Based on the latest pathogen surveillance data, trend forecasts for these variants are very uncertain. Due to the current co-circulation of these variants, it is impossible to predict long-term trends at this point. In the short term, the percentages of BQ.1 and BQ.1.1 seem to be rising most rapidly. It is also possible that multiple variants, including BA.4.6, BF.7, BQ.1 and other BA.5 sub-variants, will continue circulating at the same time. These sub-variants are being monitored and the trend forecasts are updated weekly based on new data from pathogen surveillance.
These variants seem to be increasing slowly in the Netherlands and in a number of surrounding countries. The sub-variants seem to have minor specific mutations in the spike protein that enable them to more easily evade the immunity built up against SARS-CoV-2 (by vaccination or previous infection). It is still too early to assess how much the new sub-variants will lead to a further increase in the number of SARS-CoV-2 infections, separate from any increase due to the seasonal effect.
| Reports of people tested for SARS-CoV-2 who had a positive test result | 18 October to 25 October1,2 | 11 October to 18 October3,4 |
| Number of newly reported positive tests (by date as published by RIVM) |
17,623 (94 per 100,000 inhabitants) |
22,688 (121 per 100,000 inhabitants) |
| Hospital admissions by calendar week | Week 421 | Week 413 |
|
Total new hospital admissions of patients with SARS-COV-2 (including ICU admissions) New hospital admissions of patients with SARS-CoV-2 (including ICU admissions) not including patients with an admission reason other than SARS-CoV-2 (Source: NICE)5 |
721
603 |
677
587 |
|
Total new ICU admissions of patients with SARS-CoV-2 New ICU admissions not including patients with an admission reason other than SARS-CoV-2 (Source: NICE)5 |
51 39 |
48 35 |
| Infection Radar by calendar week | Week 421 | Week 412 |
|
The percentage of Infection Radar survey participants with symptoms that could indicate COVID-196 The percentage of Infection Radar survey participants who had a positive test result7 |
5.0%
|
5.4%
|
| Reported deaths of people who tested positive for SARS-CoV-2 8 | 18 October to 25 October1,2 | 11 October to 18 October3,4 |
| Deaths | 35 | 44 |
| SARS-CoV-2 tests by the GGD per calendar week | week 429 | week 419 |
| Total number of tests of which results are known Number of positive tests Percentage of positive tests* |
23,190 |
28,789 |
| Latest calculation | One week before | |
| Reproduction numbers10 | On 4 October 2022 | On 27 September 2022 |
| Based on reported positive tests | 0,91 (0,85 – 0,97) | 0,97 (0,92 – 1,01) |
| Based on hospital admissions (Source: NICE)11 | 0,95 (0,76 – 1,15) | 0,94 (0,75 – 1,15) |
| Based on ICU admissions (Source: NICE)11 | 1,03 (0,23 – 2,11) | 1,02 (0,23 – 2,11) |
| Last week (first half of the week) | Two weeks ago (first and second half of the week) | |
| Sewage surveillance | Week 42 (17 to 19 October 2022) | Week 41 (10 to 16 October 2022) |
| Average number of virus particles (x 100 billion per 100,000 inhabitants)12 | 1717 | 1599 |
| Number of sampling locations on which the average is based | 287/31113 | 309/31114 |
| Number of people connected to those sewage treatment plants15 |
16,364,840 |
17,285,075 |
1 As published 25 October 2022 in the weekly epidemiological update on SARS-CoV-2 in the Netherlands.
2 Reports by the Municipal Public Health Services (GGDs) to RIVM between 18 October 2022 10:01 and 25 October 2022 10:00.
3As published 18 October 2022 in the weekly epidemiological update on SARS-CoV-2 in the Netherlands.
4 Reports by the Municipal Public Health Services (GGDs) to RIVM between 11 October 2022 10:01 and 18 October 2022 10:00.
5Not all patients admitted to hospital with the coronavirus SARS-CoV-2 have COVID-19 as the main reason or one of the reasons for hospital admission. The hospital and ICU admissions for which it is known that admission was due to other reasons than a SARS-CoV-2 infection (category 3 in the admission reasons) are not counted here. For an explanation of the categories of admission reasons, see the RIVM graphs page, or the weekly epidemiological update on SARS-CoV-2 in the Netherlands.
6 The number of unique survey participants reporting symptoms that could indicate COVID-19 per day who filled out a survey questionnaire, summed up for the entire calendar week (Monday through Sunday). This number is divided by the number of unique participants per day who filled out a survey questionnaire.
7The number of unique survey participants reporting a positive COVID-19 test per day, summed up for the entire calendar week (Monday through Sunday). The positive test result could come from a self-test, a PCR test or a rapid antigen test. These results are not from the nose and throat swabs sent in through the self-test study that started in September 2022.
8 Not all of these reported deaths occurred within the last week. The actual number of deaths is higher than the deaths that are reported in the surveillance. This is because there is no mandatory reporting requirement for death due to COVID-19. For that reason, the mortality figures presented here are underreported.
9 As published 25 October 2022 in the weekly epidemiological update on SARS-CoV-2 in the Netherlands. The figures from the past week and current week may be updated to include any test results provided later. These figures only include tests of people who were tested in the GGD test lanes and does not include any tests that are required in order to travel.
10 For more information about the reproduction number, click here.
11 The reproduction numbers (R) based on NICE data are calculated using hospital and ICU admissions due to COVID-19. These calculations do not include admissions registered by NICE after 25 January 2022 for any reason other than COVID-19.
12 Based on data available at RIVM on Monday afternoon, 24 October 2022, as published in the open data. See the sewage surveillance updates on the Coronavirus Dashboard for the latest figures. See the explanation of the data presented for more details about how these figures are calculated.
13 In the first half of last week, between 1 and 3 samples were taken from each sampling location and analysed. The samples were taken on the Monday, Tuesday and/or Wednesday of that week.
14 Ideally, a total of 4 sewage samples from all 311 sampling locations would be taken and analysed in order to calculate the average for the previous week.
15 Number of people connected to the number of sampling locations on which the average is based.
18 October 2022 | 17:00
Vaccination figures for autumn round of COVID-19 repeat vaccination
From 19 September to 16 October 2022, nearly 1.9 million repeat vaccinations against COVID-19 were administered. Most of the repeat vaccinations administered last week were in the age group of 60 years and older. Vaccination coverage for the repeat vaccination among people over 60 has now reached 33.8%. Vaccination coverage among people over 70 is now 45.8%, and among people over 80 it has reached 45.5%.
Read more in the weekly update on COVID-19 vaccination figures.
18 October 2022 | 16:45
Weekly update on the coronavirus SARS-CoV-2: 18 October 2022
As of 16 September 2022, the Coronavirus Dashboard provided by the national government also includes the coronavirus thermometer. The thermometer offers a visual representation of pressure on society and healthcare as a result of the coronavirus SARS-CoV-2. The coronavirus thermometer is based on the epidemiological situation and the associated RIVM analysis.
The RIVM Response Team advises coronavirus thermometer: status 2 – increased (Limited pressure on healthcare chain and society, but increased risks are expected for vulnerable groups)
Sewage surveillance
In week 40 (3-9 October 2022), sewage surveillance showed that the national average viral load increased by 20%. In the first half of week 41 (10 – 12 October), the average number of virus particles decreased, dropping by +15%. In both weeks, the highest figures were seen in Amsterdam and the surrounding area. The Omicron BA.5 variant and all its sub-variants were still detected most frequently in sewage surveillance, and BA.4 was also observed more frequently again.
Virus variants from pathogen surveillance
RIVM has observed various Omicron sub-variants in pathogen surveillance. Since June 2022, BA.5 has been the dominant variant in the Netherlands.
Various sub-variants of BA.2, BA.4 and BA.5 are now present and under monitoring. This includes BA.2.75 and BA.2.12.1, BA.4.6, and various BA.5 sub-variants, such as BF.7, BQ.1 and BQ.1.1. Recombinant strains of variants, such as XBB (twice so far, detected in pathogen surveillance in week 38), are also being monitored.
The percentages of BA.2.75 and BA.4.6 have been slowly increasing in pathogen surveillance in recent weeks. Trend forecasts for BA.4.6, BA.2.75 and sub-variants of BA.5 based on the latest pathogen surveillance data are very uncertain. Within the BA.5 lineage, several sub-variants are increasing (such as BQ.1, BQ.1.1 and BF.7), while other sub-variants are decreasing. It is also possible that multiple variants, including BA.2.75, BA.4.6 and other BA.5 sub-variants, will continue circulating at the same time. These Omicron sub-variants seem to have minor specific mutations in the spike protein that enable them to more easily evade the immunity built up against SARS-CoV-2 (by vaccination or previous infection).
It is still too early to assess whether the new sub-variants will lead to a further increase in the number of SARS-CoV-2 infections, separate from any increase due to the seasonal effect. These sub-variants seem to be increasing slowly in the Netherlands and in a number of surrounding countries.
Infection Radar, testing, and hospital and ICU admissions
In the Infection Radar survey, the percentage of people who reported possible symptoms of COVID-19 last week decreased (+5.4%) compared to the week before that (+6.2%). The number of people who tested positive for COVID-19 (SARS-CoV-2) reported to the Municipal Public Health Services (GGDs) stabilised (-4%) last week compared to the week before that. The number of people who were tested for COVID-19 by the GGD decreased slightly (-5%). The number of nursing home residents who tested positive for COVID-19 rose by 11% last week1,3.
On 4 October 2022, the reproduction number based on reported positive tests was 0.97 (0.92 – 1.01). The number of new hospital admissions of patients with SARS-CoV-2 remained stable (-2%) compared to the week before. The number of new ICU admissions of patients with SARS-CoV-2 increased; there were 48 ICU admissions last week (+17%), compared to 41 ICU admissions the week before.
| Reports of people tested for SARS-CoV-2 who had a positive test result | 11 October to 18 October1,2 | 4 October to 11 October3,4 |
| Number of newly reported positive tests (by date as published by RIVM) |
22,688 (121 per 100,000 inhabitants) |
23,693 (129 per 100,000 inhabitants) |
| Hospital admissions by calendar week | Week 411 | Week 403 |
|
Total new hospital admissions of patients with SARS-COV-2 (including ICU admissions) New hospital admissions of patients with SARS-CoV-2 (including ICU admissions) not including patients with an admission reason other than SARS-CoV-2 (Source: NICE)5 |
677
587 |
693
601 |
|
Total new ICU admissions of patients with SARS-CoV-2 New ICU admissions not including patients with an admission reason other than SARS-CoV-2 (Source: NICE)5 |
48 35 |
41 30 |
| Infection Radar by calendar week | Week 411 | Week 402 |
|
The percentage of Infection Radar survey participants with symptoms that could indicate COVID-196 The percentage of Infection Radar survey participants who had a positive test result7 |
5.4%
|
6.2%
|
| Reported deaths of people who tested positive for SARS-CoV-2 8 | 11 October to 18 October1,2 | 4 October to 11 October3,4 |
| Deaths | 44 | 39 |
| SARS-CoV-2 tests by the GGD per calendar week | week 419 | week 409 |
| Total number of tests of which results are known Number of positive tests Percentage of positive tests* |
28,787 |
30,297 |
| Latest calculation | One week before | |
| Reproduction numbers10 | On 4 October 2022 | On 27 September 2022 |
| Based on reported positive tests | 0.97 (0.92 – 1.01) | 1.13 (1.07 – 1.19) |
| Based on hospital admissions (Source: NICE)11 | 0.94 (0.75 – 1.15) | 1.02 (0.81 – 1.25) |
| Based on ICU admissions (Source: NICE)11 | 1.02 (0.23 – 2.11) | 1.08 (0.00 – 2.71) |
| Last week (first half of the week) | Two weeks ago (first and second half of the week) | |
| Sewage surveillance | Week 41 (10 to 12 October 2022) | Week 40 (3 to 9 October 2022) |
| Average number of virus particles (x 100 billion per 100,000 inhabitants)12 | 1461 | 1715 |
| Number of sampling locations on which the average is based | 289/31113 | 306/31114 |
| Number of people connected to those sewage treatment plants15 |
15,311,464 |
16,864,930 |
1 As published 18 October 2022 in the weekly epidemiological update on SARS-CoV-2 in the Netherlands.
2 Reports by the Municipal Public Health Services (GGDs) to RIVM between 11 October 2022 10:01 and 18 October 2022 10:00.
3As published 11 October 2022 in the weekly epidemiological update on SARS-CoV-2 in the Netherlands.
4 Reports by the Municipal Public Health Services (GGDs) to RIVM between 4 October 2022 10:01 and 11 October 2022 10:00.
5Not all patients admitted to hospital with the coronavirus SARS-CoV-2 have COVID-19 as the main reason or one of the reasons for hospital admission. The hospital and ICU admissions for which it is known that admission was due to other reasons than a SARS-CoV-2 infection (category 3 in the admission reasons) are not counted here. For an explanation of the categories of admission reasons, see the RIVM graphs page, or the weekly epidemiological update on SARS-CoV-2 in the Netherlands.
6 The number of unique survey participants reporting symptoms that could indicate COVID-19 per day who filled out a survey questionnaire, summed up for the entire calendar week (Monday through Sunday). This number is divided by the number of unique participants per day who filled out a survey questionnaire.
7The number of unique survey participants reporting a positive COVID-19 test per day, summed up for the entire calendar week (Monday through Sunday). The positive test result could come from a self-test, a PCR test or a rapid antigen test. These results are not from the nose and throat swabs sent in through the self-test study that started in September 2022.
8 Not all of these reported deaths occurred within the last week. The actual number of deaths is higher than the deaths that are reported in the surveillance. This is because there is no mandatory reporting requirement for death due to COVID-19. For that reason, the mortality figures presented here are underreported.
9 As published 18 October 2022 in the weekly epidemiological update on SARS-CoV-2 in the Netherlands. The figures from the past week and current week may be updated to include any test results provided later. These figures only include tests of people who were tested in the GGD test lanes and does not include any tests that are required in order to travel.
10 For more information about the reproduction number, click here.
11 The reproduction numbers (R) based on NICE data are calculated using hospital and ICU admissions due to COVID-19. These calculations do not include admissions registered by NICE after 25 January 2022 for any reason other than COVID-19.
12 Based on data available at RIVM on Monday afternoon, 17 October 2022, as published in the open data. See the sewage surveillance updates on the Coronavirus Dashboard for the latest figures. See the explanation of the data presented for more details about how these figures are calculated.
13 In the first half of last week, between 1 and 3 samples were taken from each sampling location and analysed. The samples were taken on the Monday, Tuesday and/or Wednesday of that week.
14 Ideally, a total of 4 sewage samples from all 311 sampling locations would be taken and analysed in order to calculate the average for the previous week.
15 Number of people connected to the number of sampling locations on which the average is based.
11 October 2022 | 17:00
Vaccination figures for autumn round of COVID-19 repeat vaccination
From 19 September to 9 October 2022, more than 1.2 million repeat vaccinations against COVID-19 were administered. Most of the repeat vaccinations administered last week were in the age group of 70 years and older Vaccination coverage for the repeat vaccination among people over 70 has now reached 36.2%, and among people over 70 it is now 38.1%.
Read more in the weekly update on COVID-19 vaccination figures.
11 October 2022 | 16:10
Weekly update on the coronavirus SARS-CoV-2: 11 October 2022
Read the news: Upward trend in COVID-19 figures continues: extra risk for vulnerable groups
As of 16 September 2022, the Coronavirus Dashboard provided by the national government also includes the coronavirus thermometer. The thermometer offers a visual representation of pressure on society and healthcare as a result of the coronavirus SARS-CoV-2. The coronavirus thermometer is based on the epidemiological situation and the associated RIVM analysis.
The RIVM Response Team advises coronavirus thermometer: status 2 – increased (Limited pressure on healthcare chain and society, but increased risks are expected for vulnerable groups)
Sewage surveillance
In week 39 (26 September – 2 October 2022), sewage surveillance showed that the national average viral load increased significantly compared to the previous week, rising by 75%. In the first half of week 40 (3 – 5 September), the average number of virus particles continue to increase, rising by +18%. The Omicron BA.5 variant and all its sub-variants are still detected most frequently in sewage surveillance, and BA.4 was also observed more frequently again.
Virus variants from pathogen surveillance
RIVM has observed various Omicron sub-variants in pathogen surveillance. Since June 2022, BA.5 has been the dominant variant in the Netherlands. At this point, pathogen surveillance shows that the percentages of BA.2.75 and BA.4.6 are slowly increasing. BA.4.6, BA.2.75 and several sub-variants of BA.5 seem to have minor specific mutations that enable them to more easily evade the immunity built up against COVID-19 (by vaccination or previous infection). It is still too early to assess whether the new sub-variants will lead to a further increase in the number of SARS-CoV-2 infections, separate from the expected increase due to the seasonal effect. This sub-variants seem to be increasing slowly in the Netherlands and in a number of surrounding countries.
Infection Radar, testing, and hospital and ICU admissions
In the Infection Radar survey, the percentage of people who reported possible symptoms of COVID-19 last week (6.2%) was about the same as the week before that (6.0%). The number of people who tested positive for COVID-19 (SARS-CoV-2) reported to the Municipal Public Health Services (GGDs) increased (+24%) last week compared to the week before that. The number of people who were tested for COVID-19 by the GGD also increased(+31%). On 27 September 2022, the reproduction number based on reported positive tests was 1.13 (1.07 – 1.19). The number of new hospital admissions of patients with SARS-CoV-2 increased (+24%) compared to the week before. The number of new ICU admissions of patients with SARS-CoV-2 increased slightly; there were 41 ICU admissions last week (+8%), compared to 38 ICU admissions the week before.
| Reports of people tested for SARS-CoV-2 who had a positive test result | 4 October to 11 October1,2 | 27 September to 4 October3,4 |
| Number of newly reported positive tests (by date as published by RIVM) |
23,693 (129 per 100,000 inhabitants) |
19,031 (105 per 100,000 inhabitants) |
| Hospital admissions by calendar week | Week 401 | Week 393 |
|
Total new hospital admissions of patients with SARS-COV-2 (including ICU admissions) New hospital admissions of patients with SARS-CoV-2 (including ICU admissions) not including patients with an admission reason other than SARS-CoV-2 (Source: NICE)5 |
693
601 |
561
485 |
|
Total new ICU admissions of patients with SARS-CoV-2 New ICU admissions not including patients with an admission reason other than SARS-CoV-2 (Source: NICE)5 |
41
30 |
38
26 |
| Infection Radar by calendar week | Week 401 | Week 392 |
| The percentage of Infection Radar survey participants with symptoms that could indicate COVID-196 | 6.2% | 46.0% |
| Reported deaths of people who tested positive for SARS-CoV-2 7 | 4 October to 11 October1,2 | 27 September to 4 October3,4 |
| Deaths | 39 | 20 |
| SARS-CoV-2 tests by the GGD per calendar week | week 408 | week 398 |
| Total number of tests of which results are known Number of positive tests Percentage of positive tests* |
30.297 19.182 |
23.048 14.506 |
| Latest calculation | One week before | |
| Reproduction numbers9 | On 27 September 2022 | On 20 September 2022 |
| Based on reported positive tests | 1,13 (1,07 – 1,19) | 1,18 (1,11 – 1,25) |
| Based on hospital admissions (Source: NICE)10 | 1,02 (0,81 – 1,25) | 1,11 (0,85 – 1,40) |
| Based on ICU admissions (Source: NICE)10 | 1,08 (0.00 – 2,71) | 1,15 (0,00 – 2,71) |
| Last week (first half of the week) | Two weeks ago (first and second half of the week) | |
| Sewage surveillance | Week 40 (3 to 5 October 2022) | Week 39 (26 September to 2 October 2022) |
| Average number of virus particles (x 100 billion per 100,000 inhabitants)11 | 1689 | 1436 |
| Number of sampling locations on which the average is based | 271/31112 | 283/31113 |
| Number of people connected to those sewage treatment plants14 |
15,704,922 |
16,333,742 |
1 As published 11 October 2022 in the weekly epidemiological update on SARS-CoV-2 in the Netherlands.
2 Reports by the Municipal Public Health Services (GGDs) to RIVM between 4 October 2022 10:01 and 11 October 2022 10:00.
3As published 24 October 2022 in the weekly epidemiological update on SARS-CoV-2 in the Netherlands.
4 Reports by the Municipal Public Health Services (GGDs) to RIVM between 27 September 2022 10:01 and 4 Octber 2022 10:00.
5Not all patients admitted to hospital with the coronavirus SARS-CoV-2 have COVID-19 as the main reason or one of the reasons for hospital admission. The hospital and ICU admissions for which it is known that admission was due to other reasons than a SARS-CoV-2 infection (category 3 in the admission reasons) are not counted here. For an explanation of the categories of admission reasons, see the RIVM graphs page, or the weekly epidemiological update on SARS-CoV-2 in the Netherlands.
6 The number of unique survey participants reporting symptoms that could indicate COVID-19 per day who filled out a survey questionnaire, summed up for the entire calendar week (Monday through Sunday). This number is divided by the number of unique participants per day who filled out a survey questionnaire.
7 Not all of these reported deaths occurred within the last week. The actual number of deaths is higher than the deaths that are reported in the surveillance. This is because there is no mandatory reporting requirement for death due to COVID-19. For that reason, the mortality figures presented here are underreported.
8 As published 11 October 2022 in the weekly epidemiological update on SARS-CoV-2 in the Netherlands. The figures from the past week and current week may be updated to include any test results provided later. These figures only include tests of people who were tested in the GGD test lanes and does not include any tests that are required in order to travel.
9 For more information about the reproduction number, click here.
10 The reproduction numbers (R) based on NICE data are calculated using hospital and ICU admissions due to COVID-19. These calculations do not include admissions registered by NICE after 25 January 2022 for any reason other than COVID-19.
11 Based on data available at RIVM on Monday afternoon, 10 October 2022, as published in the open data. See the sewage surveillance updates on the Coronavirus Dashboard for the latest figures. See the explanation of the data presented for more details about how these figures are calculated.
12 In the first half of last week, between 1 and 3 samples were taken from each sampling location and analysed. The samples were taken on the Monday, Tuesday and/or Wednesday of that week.
13 Ideally, a total of 4 sewage samples from all 311 sampling locations would be taken and analysed in order to calculate the average for the previous week.
14 Number of people connected to the number of sampling locations on which the average is based.
4 October 2022 | 16:30
Vaccination figures for autumn round of COVID-19 repeat vaccination
From 19 September to 2 October 2022, more than 709,600 repeat vaccinations against COVID-19 were administered. Most of the repeat vaccinations administered last week were in the age group of 70 years and older. Vaccination coverage for the repeat vaccination among people over 70 has now reached 22.1%.
Read more in the weekly update on COVID-19 vaccination figures.
4 October 2022 | 17:30
Weekly update on the coronavirus SARS-CoV-2: 4 October 2022
As of 16 September 2022, the Coronavirus Dashboard provided by the national government also includes the coronavirus thermometer. The thermometer offers a visual representation of pressure on society and healthcare as a result of the coronavirus SARS-CoV-2. The coronavirus thermometer is based on the epidemiological situation and the associated RIVM analysis.
The RIVM Response Team advises coronavirus thermometer: status 1 - low
Sewage surveillance
In week 38 (19–25 September 2022), sewage surveillance showed that the national average viral load rose by 24% compared to the previous week. In the first half of week 39 (26–28 September 2022), the average number of virus particles continued to increase, rising by 55%. The BA.5 Omicron sub-variant is still detected most frequently in sewage surveillance.
Virus variants from pathogen surveillance
Pathogen surveillance shows the same trend as last week.
Based on pathogen surveillance, there appears to be an increase in two Omicron sub-variants: BA4.6 and BA2.75. The trend forecasts are updated weekly based on new data from pathogen surveillance. RIVM will continue monitoring the situation as it develops.
Infection Radar, testing, and hospital and ICU admissions
In the Infection Radar survey, the percentage of people who reported possible symptoms of COVID-19 last week increased again (+6.0%) compared to the week before that (+4.6%). The number of people who tested positive for COVID-19 (SARS-CoV-2) reported to the Municipal Public Health Services (GGDs) increased (+55%) last week compared to the week before that. The number of people who were tested for COVID-19 by the GGD also increased (+47%). On 20 September 2022, the reproduction number based on reported positive tests was 1.18 (1.11 – 1.25). The number of new hospital admissions of patients with SARS-CoV-2 increased significantly (+68%) compared to the week before. The number of new ICU admissions of patients with SARS-CoV-2 more than doubled; there were 38 ICU admissions last week (+138%), compared to 16 ICU admissions the week before.
| Reports of people tested for SARS-CoV-2 who had a positive test result | 27 September to 4 October1,2 | 20 September to 27 September3,4 |
| Number of newly reported positive tests (by date as published by RIVM) |
19,031 (105 per 100,000 inhabitants) |
12,269 (68 per 100,000 inhabitants) |
| Hospital admissions by calendar week | Week 391 | Week 383 |
|
Total new hospital admissions of patients with SARS-COV-2 (including ICU admissions) New hospital admissions of patients with SARS-CoV-2 (including ICU admissions) not including patients with an admission reason other than SARS-CoV-2 (Source: NICE)5 |
561
485 |
333
287 |
|
Total new ICU admissions of patients with SARS-CoV-2 New ICU admissions not including patients with an admission reason other than SARS-CoV-2 (Source: NICE)5 |
38
26 |
16
11 |
| Infection Radar by calendar week | Week 39 | Week 38 |
| The percentage of Infection Radar survey participants with symptoms that could indicate COVID-196 | 6.0% | 4.6% |
| Reported deaths of people who tested positive for SARS-CoV-2 7 | 27 September to 4 October1,2 | 20 September to 27 September3,4 |
| Deaths | 20 | 13 |
| SARS-CoV-2 tests by the GGD per calendar week | week 398 | week 388 |
| Total number of tests of which results are known Number of positive tests Percentage of positive tests* |
23,048 14,505 |
15,694 9,409 |
| Latest calculation | One week before | |
| Reproduction numbers9 | On 20 September 2022 | On 13 September 2022 |
| Based on reported positive tests | 1,18 (1,11 – 1,25) | 1,03 (0,96 – 1,11) |
| Based on hospital admissions (Source: NICE)10 | 1,11 (0,85 – 1,40) | 1,06 (0,74 – 1,43) |
| Based on ICU admissions (Source: NICE)10 | 1,15 (0,00 – 2,71) | 1,04 (0,00 – 2,71) |
| Last week (first half of the week) | Two weeks ago (first and second half of the week) | |
| Sewage surveillance | Week 39 (26 to 28 September 2022) | Week 38 (19 to 25 September 2022) |
| Average number of virus particles (x 100 billion per 100,000 inhabitants)11 | 1268 | 818 |
| Number of sampling locations on which the average is based | 207/31112 | 309/31113 |
| Number of people connected to those sewage treatment plants14 |
12,258,589 |
17,265,003 |
1 As published 4 October 2022 in the weekly epidemiological update on SARS-CoV-2 in the Netherlands.
2 Reports by the Municipal Public Health Services (GGDs) to RIVM between 27 September 2022 10:01 and 4 October 2022 10:00.
3As published 27 September 2022 in the weekly epidemiological update on SARS-CoV-2 in the Netherlands.
4 Reports by the Municipal Public Health Services (GGDs) to RIVM between 20 September 2022 10:01 and 27 September 2022 10:00.
5Not all patients admitted to hospital with the coronavirus SARS-CoV-2 have COVID-19 as the main reason or one of the reasons for hospital admission. The hospital and ICU admissions for which it is known that admission was due to other reasons than a SARS-CoV-2 infection (category 3 in the admission reasons) are not counted here. For an explanation of the categories of admission reasons, see the RIVM graphs page, or the weekly epidemiological update on SARS-CoV-2 in the Netherlands.
6 The number of unique survey participants reporting symptoms that could indicate COVID-19 per day who filled out a survey questionnaire, summed up for the entire calendar week (Monday through Sunday). This number is divided by the number of unique participants per day who filled out a survey questionnaire.
7 Not all of these reported deaths occurred within the last week. The actual number of deaths is higher than the deaths that are reported in the surveillance. This is because there is no mandatory reporting requirement for death due to COVID-19. For that reason, the mortality figures presented here are underreported.
8 As published 4 October 2022 in the weekly epidemiological update on SARS-CoV-2 in the Netherlands. The figures from the past week and current week may be updated to include any test results provided later. These figures only include tests of people who were tested in the GGD test lanes and does not include any tests that are required in order to travel.
9 For more information about the reproduction number, click here.
10 The reproduction numbers (R) based on NICE data are calculated using hospital and ICU admissions due to COVID-19. These calculations do not include admissions registered by NICE after 25 January 2022 for any reason other than COVID-19.
11 Based on data available at RIVM on Monday afternoon, 3 October 2022, as published in the open data. See the sewage surveillance updates on the Coronavirus Dashboard for the latest figures. See the explanation of the data presented for more details about how these figures are calculated.
12 In the first half of last week, between 1 and 3 samples were taken from each sampling location and analysed. The samples were taken on the Monday, Tuesday and/or Wednesday of that week.
13 Ideally, a total of 4 sewage samples from all 311 sampling locations would be taken and analysed in order to calculate the average for the previous week.
14 Number of people connected to the number of sampling locations on which the average is based.
27 September 2022 | 17:00
Weekly update on the coronavirus SARS-CoV-2: 27 September 2022
As of 16 September 2022, the Coronavirus Dashboard provided by the national government also includes the coronavirus thermometer. The thermometer offers a visual representation of pressure on society and healthcare as a result of the coronavirus SARS-CoV-2. The coronavirus thermometer is based on the epidemiological situation and the associated RIVM analysis.
The RIVM Response Team advises coronavirus thermometer: status 1 - low
As of 17 May 2022, expanded information about the coronavirus SARS-CoV-2 is provided on this page. In addition to figures on positive tests and hospital admissions, the page also includes information from the Infection Radar surveys, sewage surveillance and pathogen surveillance.
Infection Radar, testing, and hospital and ICU admissions
In the Infection Radar survey, the percentage of people who reported possible symptoms of COVID-19 last week increased again (+4.6%) compared to the week before that (+3.1%). The number of people who tested positive for COVID-19 (SARS-CoV-2) reported to the Municipal Public Health Services (GGDs) increased (+39%) last week compared to the week before that. The number of people who were tested for COVID-19 by the GGD also increased (+27%). On 13 September 2022, the reproduction number based on reported positive tests was 1.03 (0.96 – 1.11). The number of new hospital admissions of patients with SARS-CoV-2 increased significantly (+34%) compared to the week before. The number of new ICU admissions of patients with SARS-CoV-2 remained relatively low; there were 16 ICU admissions last week (-11%), compared to 18 ICU admissions the week before.
Sewage surveillance
In week 37 (12–18 September 2022), the national average viral load remained about the same as last week, rising very slightly (+0.3%). Compared to the other regions, sewage surveillance figures were highest in and around Amsterdam and in Limburg-Noord. A similar trend was observed in the first half of week 38 (19–21 September), resulting in a minor increase (+6.3%). Sewage surveillance figures were highest in IJsselland and Kennemerland. The BA.5 Omicron sub-variant is still detected most frequently in sewage surveillance.
Virus variants from pathogen surveillance
So far, the Omicron variant has five sub-variants that are currently being monitored closely. These have been designated BA.1, BA.2 (including sub-variants BA.2.12.1 and BA.2.75), BA.3, BA.4 and BA.5.
According to the WHO, these variants do not appear to cause more serious illness than the BA.2 variant that was recently most prevalent in the Netherlands. However, there are indications that antibodies may be less effective against these variants.
Sub-variant BA.5 became dominant in the Netherlands in June 2022. The percentage of these and other variants is being monitored in the context of pathogen surveillance and by means of variant PCR.
Since July 2022, various countries have recently observed a new sub-variant of the Omicron BA.2 lineage: BA.2.75. This sub-variant has been found in India, Australia, Japan, Canada, the USA, Germany, Denmark and the UK, among other countries. BA.2.75 has been increasing recently in pathogen surveillance in the Netherlands. It is too early to say whether this will lead to an increase in the number of infections. BA.2.75 seems to have minor specific mutations that enable it to more easily evade the immunity built up against COVID-19 (by vaccination or previous infection). There are no indications that the BA.2.75 sub-variant would be more likely to cause severe illness compared to the other Omicron sub-variants. This sub-variant seems to be increasing slowly in the Netherlands and in the surrounding countries. RIVM will continue monitoring the situation.
Based on the latest pathogen surveillance data, trend forecasts for BA.2.75 suggest that this sub-variant may become dominant in the Netherlands later this year. However, the margins of uncertainty are still very significant. These trend forecasts are updated weekly based on new data from pathogen surveillance.
| Reports of people tested for SARS-CoV-2 who had a positive test result | 20 September to 27 September1,2 | 13 September to 20 September3,4 |
| Number of newly reported positive tests (by date as published by RIVM) |
12,269 (68 per 100,000 inhabitants) |
8,820 (49 per 100,000 inhabitants) |
| Hospital admissions by calendar week | Week 381 | Week 373 |
|
Total new hospital admissions of patients with SARS-COV-2 (including ICU admissions) New hospital admissions of patients with SARS-CoV-2 (including ICU admissions) not including patients with an admission reason other than SARS-CoV-2 (Source: NICE)5 |
333
287 |
249
204 |
|
Total new ICU admissions of patients with SARS-CoV-2 New ICU admissions not including patients with an admission reason other than SARS-CoV-2 (Source: NICE)5 |
16
11 |
18
12 |
| Infection Radar by calendar week | Week 38 | Week 37 |
| The percentage of Infection Radar survey participants with symptoms that could indicate COVID-196 | 4.6% | 3.1% |
| Reported deaths of people who tested positive for SARS-CoV-2 7 | 20 September to 27 September1,2 | 13 September to 20 September3,4 |
| Deaths | 13 | 10 |
| SARS-CoV-2 tests by the GGD per calendar week | week 388 | week 378 |
| Total number of tests of which results are known Number of positive tests Percentage of positive tests* |
15,641 9,370 |
12,357 7,151 |
| Latest calculation | One week before | |
| Reproduction numbers9 | On 13 September 2022 | On 6 September 2022 |
| Based on reported positive tests | 1,03 (0,96 – 1,11) | 0,97 (0,91 – 1,04) |
| Based on hospital admissions (Source: NICE)10 | 1,06 (0,74 – 1,43) | 0,95 (0,62 – 1,32) |
| Based on ICU admissions (Source: NICE)10 | 1,04 (0,00 – 2,71) | 1,09 (0,00 – 3,61) |
| Last week (first half of the week) | Two weeks ago (first and second half of the week) | |
| Sewage surveillance | Week 38 (19 to 21 September 2022) | Week 37 (12 to 18 September 2022) |
| Average number of virus particles (x 100 billion per 100,000 inhabitants)11 | 704 | 662 |
| Number of sampling locations on which the average is based | 291/31112 | 309/31113 |
| Number of people connected to those sewage treatment plants14 |
16,462,754 |
17,111,572 |
1 As published 27 September 2022 in the weekly epidemiological update on SARS-CoV-2 in the Netherlands.
2 Reports by the Municipal Public Health Services (GGDs) to RIVM between 20 September 2022 10:01 and 27 September2022 10:00.
3As published 20 September 2022 in the weekly epidemiological update on SARS-CoV-2 in the Netherlands.
4 Reports by the Municipal Public Health Services (GGDs) to RIVM between 13 September 2022 10:01 and 20 September 2022 10:00.
5Not all patients admitted to hospital with the coronavirus SARS-CoV-2 have COVID-19 as the main reason or one of the reasons for hospital admission. The hospital and ICU admissions for which it is known that admission was due to other reasons than a SARS-CoV-2 infection (category 3 in the admission reasons) are not counted here. For an explanation of the categories of admission reasons, see the RIVM graphs page, or the weekly epidemiological update on SARS-CoV-2 in the Netherlands.
6 The number of unique survey participants reporting symptoms that could indicate COVID-19 per day who filled out a survey questionnaire, summed up for the entire calendar week (Monday through Sunday). This number is divided by the number of unique participants per day who filled out a survey questionnaire.
7 Not all of these reported deaths occurred within the last week. The actual number of deaths is higher than the deaths that are reported in the surveillance. This is because there is no mandatory reporting requirement for death due to COVID-19. For that reason, the mortality figures presented here are underreported.
8 As published 27 September 2022 in the weekly epidemiological update on SARS-CoV-2 in the Netherlands. The figures from the past week and current week may be updated to include any test results provided later. These figures only include tests of people who were tested in the GGD test lanes and does not include any tests that are required in order to travel.
9 For more information about the reproduction number, click here.
10 The reproduction numbers (R) based on NICE data are calculated using hospital and ICU admissions due to COVID-19. These calculations do not include admissions registered by NICE after 25 January 2022 for any reason other than COVID-19.
11 Based on data available at RIVM on Monday afternoon, 26 September 2022, as published in the open data. See the sewage surveillance updates on the Coronavirus Dashboard for the latest figures. See the explanation of the data presented for more details about how these figures are calculated.
12 In the first half of last week, between 1 and 3 samples were taken from each sampling location and analysed. The samples were taken on the Monday, Tuesday and/or Wednesday of that week.
13 Ideally, a total of 4 sewage samples from all 311 sampling locations would be taken and analysed in order to calculate the average for the previous week.
14 Number of people connected to the number of sampling locations on which the average is based.
Read the news: Autumn wave of COVID-19 may be starting: vaccination and testing are key
27 September 2022 | 16:45
First vaccination figures for autumn round of COVID-19 repeat vaccination
From this week on, RIVM will start posting updates on vaccination figures for the autumn round of the repeat vaccination against COVID-19. The autumn round started last week, on 19 September 2022. Up to and including Sunday 25 September, more than 261,500 repeat vaccinations had been administered in the autumn round. Most of the repeat vaccinations administered last week were in the age group of 80 years and older. Vaccination coverage for the repeat vaccination among people over 80 has now reached 11.9%.
Read more in the weekly update on COVID-19 vaccination figures.
20 September 2022 | 16:15
Weekly update on the coronavirus SARS-CoV-2: 20 September 2022
As of 17 May 2022, expanded information about the coronavirus SARS-CoV-2 is provided on this page. In addition to figures on positive tests and hospital admissions, the page also includes information from the Infection Radar surveys, sewage surveillance and pathogen surveillance.
Infection Radar, testing, and hospital and ICU admissions
In the Infection Radar survey, the percentage of people who reported possible symptoms of COVID-19 last week increased again (+3.1%) compared to the week before that (+2.4%). The number of people who tested positive for COVID-19 (SARS-CoV-2) reported to the Municipal Public Health Services (GGDs) increased slightly (+6%) compared to the week before that. The number of people who were tested for COVID-19 by the GGD also increased slightly (+8%). On 6 September 2022, the reproduction number based on reported positive tests was 0.97 (0.91 – 1.04). The number of new hospital admissions of patients with SARS-CoV-2 was stable (-3%) compared to the week before. The number of new ICU admissions of patients with SARS-CoV-2 remained relatively low; there were 18 ICU admissions last week (+13%), compared to 16 ICU admissions the week before.
Sewage surveillance
In sewage surveillance, the national average viral load increased (+21.2%) in week 36 (5 – 11 September 2022), but decreased again (-22.6%) in the first half of week 37 (12 – 14 September). The regions that showed the biggest increase (Brabant-Noord) or the highest sewage surveillance figures (Gooi- en Vechtstreek, Brabant-Zuidoost) in week 36 also showed the biggest decrease in the first half of week 37. The BA.5 Omicron sub-variant is still observed most frequently in sewage surveillance. One sample was found to contain a Delta variant, and one sample contained the Omicron BA.2.75 variant.
Virus variants from pathogen surveillance
So far, the Omicron variant has five sub-variants that are currently being monitored closely. These have been designated BA.1, BA.2 (including sub-variants BA.2.12.1 and BA.2.75), BA.3, BA.4 and BA.5.
According to the WHO, these variants do not appear to cause more serious illness than the BA.2 variant that was recently most prevalent in the Netherlands. However, there are indications that antibodies may be less effective against these variants.
Sub-variant BA.5 became dominant in the Netherlands in June 2022. The percentage of these and other variants is being monitored in the context of pathogen surveillance and by means of variant PCR.
Since July 2022, various countries have recently observed a new sub-variant of the Omicron BA.2 lineage: BA.2.75. This sub-variant has been found in India, Australia, Japan, Canada, the USA, Germany, Denmark and the UK, among other countries. BA.2.75 has been increasing recently in pathogen surveillance in the Netherlands. It is too early to say whether this will lead to an increase in the number of infections. BA.2.75 seems to have minor specific mutations that enable it to more easily evade the immunity built up against COVID-19 (by vaccination or previous infection). There are no indications that the BA.2.75 sub-variant would be more likely to cause severe illness compared to the other Omicron sub-variants. This sub-variant seems to be increasing slowly in the Netherlands and in the surrounding countries. RIVM will continue monitoring the situation.
Based on the latest pathogen surveillance data, trend forecasts for BA.2.75 suggest that this sub-variant may become dominant in the Netherlands later this year. However, the margins of uncertainty are still very significant. These trend forecasts are updated weekly based on new data from pathogen surveillance.
| Reports of people tested for SARS-CoV-2 who had a positive test result | 13 September to 20 September1,2 | 6 September to 13 September3,4 |
| Number of newly reported positive tests (by date as published by RIVM) |
8,820 (49 per 100,000 inhabitants) |
8,327 (46 per 100,000 inhabitants) |
| Hospital admissions by calendar week | Week 371 | Week 363 |
|
Total new hospital admissions of patients with SARS-COV-2 (including ICU admissions) New hospital admissions of patients with SARS-CoV-2 (including ICU admissions) not including patients with an admission reason other than SARS-CoV-2 (Source: NICE)5 |
249
204 |
256
219 |
|
Total new ICU admissions of patients with SARS-CoV-2 New ICU admissions not including patients with an admission reason other than SARS-CoV-2 (Source: NICE)5 |
18
12 |
16
11 |
| Reported deaths of people who tested positive for SARS-CoV-2 6 | 13 September to 20 September1,2 | 6 September to 13 September3,4 |
| Deaths | 10 | 11 |
| SARS-CoV-2 tests by the GGD per calendar week | week 377 | week 367 |
| Total number of tests of which results are known Number of positive tests Percentage of positive tests* |
12,358 7,152 |
11,398 6,784 |
| Latest calculation | One week before | |
| Reproduction numbers8 | On 6 September 2022 | On 30 August 2022 |
| Based on reported positive tests | 0,97 (0,91 – 1,04) | 1,04 (0,96 – 1,11) |
| Based on hospital admissions (Source: NICE)9 | 0,95 (0,62 – 1,32) | 1,02 (0,68 – 1,42) |
| Based on ICU admissions (Source: NICE)9 | 1,09 (0,00 – 3,16) | 0,98 (0,00 – 2,71) |
| Last week (first half of the week) | Two weeks ago (first and second half of the week) | |
| Sewage surveillance | Week 37 (12 to 14 September 2022) | Week 35 (5 to 11 September 2022) |
| Average number of virus particles (x 100 billion per 100,000 inhabitants)10 | 512 | 661 |
| Number of sampling locations on which the average is based | 297/31111 | 307/31112 |
| Number of people connected to those sewage treatment plants13 |
16,718,306 |
16,961,366 |
1 As published 20 September 2022 in the weekly epidemiological update on SARS-CoV-2 in the Netherlands.
2 Reports by the Municipal Public Health Services (GGDs) to RIVM between 13 September 2022 10:01 and 20 September2022 10:00.
3As published 13 September 2022 in the weekly epidemiological update on SARS-CoV-2 in the Netherlands.
4 Reports by the Municipal Public Health Services (GGDs) to RIVM between 6 September 2022 10:01 and 13 September 2022 10:00.
5Not all patients admitted to hospital with the coronavirus SARS-CoV-2 have COVID-19 as the main reason or one of the reasons for hospital admission. The hospital and ICU admissions for which it is known that admission was due to other reasons than a SARS-CoV-2 infection (category 3 in the admission reasons) are not counted here. For an explanation of the categories of admission reasons, see the RIVM graphs page, or the weekly epidemiological update on SARS-CoV-2 in the Netherlands.
6 Not all of these reported deaths occurred within the last week. The actual number of deaths is higher than the deaths that are reported in the surveillance. This is because there is no mandatory reporting requirement for death due to COVID-19. For that reason, the mortality figures presented here are underreported.
7 As published 20 September 2022 in the weekly epidemiological update on SARS-CoV-2 in the Netherlands. The figures from the past week and current week may be updated to include any test results provided later. These figures only include tests of people who were tested in the GGD test lanes and does not include any tests that are required in order to travel.
8 For more information about the reproduction number, click here.
9 The reproduction numbers (R) based on NICE data are calculated using hospital and ICU admissions due to COVID-19. These calculations do not include admissions registered by NICE after 25 January 2022 for any reason other than COVID-19.
10 Based on data available at RIVM on Monday afternoon, 19 September 2022, as published in the open data. See the sewage surveillance updates on the Coronavirus Dashboard for the latest figures. See the explanation of the data presented for more details about how these figures are calculated.
11 In the first half of last week, between 1 and 3 samples were taken from each sampling location and analysed. The samples were taken on the Monday, Tuesday and/or Wednesday of that week.
12 Ideally, a total of 4 sewage samples from all 311 sampling locations would be taken and analysed in order to calculate the average for the previous week.
13 Number of people connected to the number of sampling locations on which the average is based.
13 September 2022 | 15:55
Vaccination figures: 5 to 11 September 2022
The data flow between GGD-GHOR and RIVM is temporarily on hold. This is due to the preparations for data transfer related to the vaccinations in autumn 2022. Data publication is expected to resume in 1 to 2 weeks.
13 September 2022 | 15:50
Weekly update on the coronavirus SARS-CoV-2: 13 September 2022
As of 17 May 2022, expanded information about the coronavirus SARS-CoV-2 is provided on this page. In addition to figures on positive tests and hospital admissions, the page also includes information from the Infection Radar surveys, sewage surveillance and pathogen surveillance.
Infection Radar, testing, and hospital and ICU admissions
In the Infection Radar survey, the percentage of people who reported possible symptoms of COVID-19 last week increased (+2.4%) compared to the week before that (+1.9%). The number of people who tested positive for COVID-19 (confirmed SARS-CoV-2 infection) reported to the Municipal Public Health Services (GGDs) increased slightly (+6%) compared to the week before that. The number of people who were tested for COVID-19 by the GGD increased slightly (+6%). On 30 August 2022, the reproduction number based on reported positive tests was 1.04 (0.96 – 1.11). The number of new hospital admissions of patients with SARS-CoV-2 increased (+16%) compared to the week before. The number of new ICU admissions of patients with SARS-CoV-2 remained relatively low; there were 16 ICU admissions last week (+7%), compared to 15 ICU admissions the week before.
Sewage surveillance
In sewage surveillance, the national average viral load in week 35 (29 August – 4 September 2022) increased slightly, rising by +4.4%. A significant increase was observed in Brabant-Zuidoost, which also saw the highest figures in sewage surveillance in that period. In the first half of week 36 (5 – 7 September), the average number of virus particles increased, rising by +29.1%. A significant increase was observed in Brabant-Noord, and the highest figures in sewage surveillance were seen in Gooi- en Vechtstreek. The BA.5 Omicron sub-variant is still observed most frequently, and various samples contained characteristic mutations that had previously been found in the Delta variant.
Virus variants from pathogen surveillance
So far, the Omicron variant has five sub-variants that are currently being monitored closely. These have been designated BA.1, BA.2 (including sub-variants BA.2.12.1 and BA.2.75), BA.3, BA.4 and BA.5.
According to the WHO, these variants do not appear to cause more serious illness than the BA.2 variant that was recently most prevalent in the Netherlands. However, there are indications that antibodies may be less effective against these variants.
Sub-variant BA.5 became dominant in the Netherlands in June 2022. The percentage of these and other variants is being monitored in the context of pathogen surveillance and by means of variant PCR.
Since July 2022, various countries have recently observed a new sub-variant of the Omicron BA.2 lineage: BA.2.75. This sub-variant has been found in India, Australia, Japan, Canada, the USA, Germany, Denmark and the UK, among other countries. BA.2.75 has been increasing recently in pathogen surveillance in the Netherlands. It is too early to say whether this will lead to an increase in the number of infections. BA.2.75 seems to have minor specific mutations that enable it to more easily evade the immunity built up against COVID-19 (by vaccination or previous infection). There are no indications that the BA.2.75 sub-variant would be more likely to cause severe illness compared to the other Omicron sub-variants. This sub-variant seems to be increasing slowly in the Netherlands and in the surrounding countries. RIVM will continue monitoring the situation.
Based on the latest pathogen surveillance data, trend forecasts for BA.2.75 suggest that this sub-variant may become dominant in the Netherlands later this year. However, the margins of uncertainty are still very significant. These trend forecasts are updated weekly based on new data from pathogen surveillance.
The increase in specific variants is also being monitored in cooperation with Saltro by means of variant PCR. Variant PCR data can be accessed a bit sooner than sequencing from pathogen surveillance. Variant PCR data offers an indication for whether the BA.4/5 sub-variants are present, although this method does not detect their presence with certainty. It also does not show the differences between BA.4 and BA.5. The data also offers an indication for whether BA.2.75 is present. The latest trend forecast indicates that BA.4/5 will decrease, accompanied by an increase in other variants, such as BA.2.75. The margins of uncertainty in this forecast are still significant.
The data comes from various GGD regions, but (in contrast to pathogen surveillance data) the results do not provide a national overview. Pathogen surveillance data and variant PCR data show the same trends for the percentage of BA.4/BA.5. Saltro’s variant PCR data shows that the combined percentage of BA.4/BA.5 became dominant in early June.
| Reports of people tested for SARS-CoV-2 who had a positive test result | 6 September to 13 September1,2 | 30 August to 6 September3,4 |
| Number of newly reported positive tests (by date as published by RIVM) |
8,327 (46 per 100,000 inhabitants) |
7,856 (43 per 100,000 inhabitants) |
| Hospital admissions by calendar week | Week 361 | Week 353 |
|
Total new hospital admissions of patients with SARS-COV-2 (including ICU admissions) New hospital admissions of patients with SARS-CoV-2 (including ICU admissions) not including patients with an admission reason other than SARS-CoV-2 (Source: NICE)5 |
256
219 |
220
179 |
|
Total new ICU admissions of patients with SARS-CoV-2 New ICU admissions not including patients with an admission reason other than SARS-CoV-2 (Source: NICE)5 |
16
11 |
15
10 |
| Reported deaths of people who tested positive for SARS-CoV-2 6 | 6 September to 13 September1,2 | 30 August to 6 September3,4 |
| Deaths | 11 | 10 |
| SARS-CoV-2 tests by the GGD per calendar week | week 367 | week 357 |
| Total number of tests of which results are known Number of positive tests Percentage of positive tests* |
11,399 6,785 |
10,731 6,409 |
| Latest calculation | One week before | |
| Reproduction numbers8 | On 30 August 2022 | On 23 August 2022 |
| Based on reported positive tests | 1,04 (0,96 – 1,11) | 0,95 (0,88 – 1,02) |
| Based on hospital admissions (Source: NICE)9 | 1,02 (0,68 – 1,42) | 0,90 (0,58 – 1,26) |
| Based on ICU admissions (Source: NICE)9 | 0,98 (0,00 – 2,71) | 0,86 (0,00 – 2,71) |
| Last week (first half of the week) | Two weeks ago (first and second half of the week) | |
| Sewage surveillance | Week 36 (5 to 7 September 2022) | Week 35 (29 August to 4 September 2022) |
| Average number of virus particles (x 100 billion per 100,000 inhabitants)10 | 704 | 545 |
| Number of sampling locations on which the average is based | 284/31111 | 306/31112 |
| Number of people connected to those sewage treatment plants13 |
15,511,930 |
16,996,439 |
1 As published 13 September 2022 in the weekly epidemiological update on SARS-CoV-2 in the Netherlands.
2 Reports by the Municipal Public Health Services (GGDs) to RIVM between 6 September 2022 10:01 and 13 September2022 10:00.
3As published 6 September 2022 in the weekly epidemiological update on SARS-CoV-2 in the Netherlands.
4 Reports by the Municipal Public Health Services (GGDs) to RIVM between 30 August 2022 10:01 and 6 September 2022 10:00.
5Not all patients admitted to hospital with the coronavirus SARS-CoV-2 have COVID-19 as the main reason or one of the reasons for hospital admission. The hospital and ICU admissions for which it is known that admission was due to other reasons than a SARS-CoV-2 infection (category 3 in the admission reasons) are not counted here. For an explanation of the categories of admission reasons, see the RIVM graphs page, or the weekly epidemiological update on SARS-CoV-2 in the Netherlands.
6 Not all of these reported deaths occurred within the last week. The actual number of deaths is higher than the deaths that are reported in the surveillance. This is because there is no mandatory reporting requirement for death due to COVID-19. For that reason, the mortality figures presented here are underreported.
7 As published 13 September 2022 in the weekly epidemiological update on SARS-CoV-2 in the Netherlands. The figures from the past week and current week may be updated to include any test results provided later. These figures only include tests of people who were tested in the GGD test lanes and does not include any tests that are required in order to travel.
8 For more information about the reproduction number, click here.
9 The reproduction numbers (R) based on NICE data are calculated using hospital and ICU admissions due to COVID-19. These calculations do not include admissions registered by NICE after 25 January 2022 for any reason other than COVID-19.
10 Based on data available at RIVM on Monday afternoon, 12 September 2022, as published in the open data. See the sewage surveillance updates on the Coronavirus Dashboard for the latest figures. See the explanation of the data presented for more details about how these figures are calculated.
11 In the first half of last week, between 1 and 3 samples were taken from each sampling location and analysed. The samples were taken on the Monday, Tuesday and/or Wednesday of that week.
12 Ideally, a total of 4 sewage samples from all 311 sampling locations would be taken and analysed in order to calculate the average for the previous week.
13 Number of people connected to the number of sampling locations on which the average is based.
6 September 2022 | 16:00
Vaccination figures: 29 August to 4 September 2022
Up to and including Sunday 4 September, almost 2.7 million repeat vaccinations had been administered. People aged 60 years and older, people living in nursing homes, and people with severely impaired immunity are eligible to get a repeat vaccination against COVID-19 three months after their booster jab or three months after a SARS-CoV-2 infection. Vaccination coverage for the repeat vaccination among people over 60 has now reached 54,4%.
Read more in the weekly update on COVID-19 vaccination figures.
6 September 2022 | 15:40
Weekly update on the coronavirus SARS-CoV-2: 6 September 2022
As of 17 May 2022, expanded information about the coronavirus SARS-CoV-2 is provided on this page. In addition to figures on positive tests and hospital admissions, the page also includes information from the Infection Radar surveys, sewage surveillance and pathogen surveillance.
Infection Radar, testing, and hospital and ICU admissions
In the Infection Radar survey, the percentage of people who reported possible symptoms of COVID-19 last week increased slightly (+1.9%) compared to the week before that (+1.6%). The number of people who tested positive for COVID-19 reported to the Municipal Public Health Services (GGDs) remained the same (+2%) compared to the week before that. The number of people who were tested for COVID-19 by the GGD remained the same (+3%). On 23 August 2022, the reproduction number based on reported positive tests was 0.95 (0.88 – 1.02). The number of new hospital admissions of patients with SARS-CoV-2 decreased ( 22%) compared to the week before. The number of new ICU admissions of patients with SARS-CoV-2 remained relatively low, dropping to 15 ICU admissions last week (‑26%), compared to 20 ICU admissions the week before.
Sewage surveillance
In sewage surveillance, the national average viral load decreased slightly in week 34 (22 – 28 August 2022) and the first half of week 35 (29 – 31 August), dropping by ‑8.7% and ‑11.8% respectively. The average number of virus particles was highest in and around Amsterdam and The Hague in week 34, and in Brabant-Zuidoost in the first half of week 35 (based on preliminary figures). The BA.5 Omicron sub-variant is still observed most frequently.
Virus variants from pathogen surveillance
So far, the Omicron variant has five sub-variants that are currently being monitored closely. These have been designated BA.1, BA.2 (including sub-variants BA.2.12.1 and BA.2.75), BA.3, BA.4 and BA.5.
Since June 2022, Omicron BA.5 has been the dominant variant in the Netherlands (>90% of the tested samples since week 29). According to the WHO, these variants do not appear to cause more serious illness than the BA.2 variant that was recently most prevalent in the Netherlands. However, there are indications that antibodies may be less effective against these variants.
Since July 2022, various countries have recently observed a new sub-variant of the Omicron BA.2 lineage: BA.2.75. This sub-variant has been found in India, Australia, Japan, Canada, the USA, Germany, Denmark and the UK, among other countries. BA.2.75 has been increasing recently in pathogen surveillance in the Netherlands. It is too early to say whether this will lead to an increase in the number of infections. BA.2.75 seems to have minor specific mutations that enable it to more easily evade the immunity built up against COVID-19 (by vaccination or previous infection). There are no indications that the BA.2.75 sub-variant would be more likely to cause severe illness compared to the other Omicron sub-variants. This sub-variant seems to be increasing slowly in the Netherlands and in the surrounding countries. RIVM will continue monitoring the situation.
Based on the latest pathogen surveillance data, trend forecasts for BA.2.75 suggest that this sub-variant may become dominant in the Netherlands in October 2022. However, the margins of uncertainty are still very significant. These trend forecasts are updated weekly based on new data from pathogen surveillance. The increase in specific variants is also being monitored in cooperation with Saltro by means of variant PCR. Variant PCR data can be accessed a bit sooner than sequencing from pathogen surveillance. Variant PCR data offers an indication for whether the BA.4/5 sub-variants are present, although this method does not detect their presence with certainty. It also does not show the differences between BA.4 and BA.5. The data also offers an indication for whether BA.2.75 is present. The latest trend forecast indicates that BA.4/5 will decrease, accompanied by an increase in other variants, such as BA.2.75. The margins of uncertainty in this forecast are still significant. The data comes from various GGD regions, but (in contrast to pathogen surveillance data) the results do not provide a national overview. Pathogen surveillance data and variant PCR data show the same trends for the percentage of BA.4/BA.5. Saltro’s variant PCR data shows that the combined percentage of BA.4/BA.5 became dominant in early June.
| Reports of people tested for SARS-CoV-2 who had a positive test result | 30 August to 6 September1,2 | 23 August to 30 August3,4 |
| Number of newly reported positive tests (by date as published by RIVM) |
7,856 (43 per 100,000 inhabitants) |
7,735 (42 per 100,000 inhabitants) |
| Hospital admissions by calendar week | Week 351 | Week 343 |
|
Total new hospital admissions of patients with SARS-COV-2 (including ICU admissions) New hospital admissions of patients with SARS-CoV-2 (including ICU admissions) not including patients with an admission reason other than SARS-CoV-2 (Source: NICE)5 |
220
179 |
281
238 |
|
Total new ICU admissions of patients with SARS-CoV-2 New ICU admissions not including patients with an admission reason other than SARS-CoV-2 (Source: NICE)5 |
15
10 |
20
15 |
| Reported deaths of people who tested positive for SARS-CoV-2 6 | 30 August to 6 September1,2 | 23 August to 30 August3,4 |
| Deaths | 10 | 12 |
| SARS-CoV-2 tests by the GGD per calendar week | week 357 | week 347 |
| Total number of tests of which results are known Number of positive tests Percentage of positive tests* |
10,731 6,409 |
10,372 6,424 |
| Latest calculation | One week before | |
| Reproduction numbers8 | On 23 August 2022 | On 15 August 2022 |
| Based on reported positive tests | 0,95 (0,88 – 1,02) | 0,86 (0,81 – 0,92) |
| Based on hospital admissions (Source: NICE)9 | 0,90 (0,58 – 1,26) | 0,82 (0,56 – 1,12) |
| Based on ICU admissions (Source: NICE)9 | 0,86 (0,00 – 2,71) | 0,93 (0,00 – 2,71) |
| Last week (first half of the week) | Two weeks ago (first and second half of the week) | |
| Sewage surveillance | Week 35 (29 to 31 August 2022) | Week 34 (22 to 28 August 2022) |
| Average number of virus particles (x 100 billion per 100,000 inhabitants)10 | 459 | 520 |
| Number of sampling locations on which the average is based | 288/31111 | 309/31112 |
| Number of people connected to those sewage treatment plants13 |
15,953,267 |
17,095,520 |
1 As published 6 September 2022 in the weekly epidemiological update on SARS-CoV-2 in the Netherlands.
2 Reports by the Municipal Public Health Services (GGDs) to RIVM between 30 August 2022 10:01 and 6 September2022 10:00.
3As published 30 August 2022 in the weekly epidemiological update on SARS-CoV-2 in the Netherlands.
4 Reports by the Municipal Public Health Services (GGDs) to RIVM between 23 August 2022 10:01 and 30 August 2022 10:00.
5Not all patients admitted to hospital with the coronavirus SARS-CoV-2 have COVID-19 as the main reason or one of the reasons for hospital admission. The hospital and ICU admissions for which it is known that admission was due to other reasons than a SARS-CoV-2 infection (category 3 in the admission reasons) are not counted here. For an explanation of the categories of admission reasons, see the RIVM graphs page, or the weekly epidemiological update on SARS-CoV-2 in the Netherlands.
6 Not all of these reported deaths occurred within the last week. The actual number of deaths is higher than the deaths that are reported in the surveillance. This is because there is no mandatory reporting requirement for death due to COVID-19. For that reason, the mortality figures presented here are underreported.
7 As published 6 September 2022 in the weekly epidemiological update on SARS-CoV-2 in the Netherlands. The figures from the past week and current week may be updated to include any test results provided later. These figures only include tests of people who were tested in the GGD test lanes and does not include any tests that are required in order to travel.
8 For more information about the reproduction number, click here.
9 The reproduction numbers (R) based on NICE data are calculated using hospital and ICU admissions due to COVID-19. These calculations do not include admissions registered by NICE after 25 January 2022 for any reason other than COVID-19.
10 Based on data available at RIVM on Monday afternoon, 5 September 2022, as published in the open data. See the sewage surveillance updates on the Coronavirus Dashboard for the latest figures. See the explanation of the data presented for more details about how these figures are calculated.
11 In the first half of last week, between 1 and 3 samples were taken from each sampling location and analysed. The samples were taken on the Monday, Tuesday and/or Wednesday of that week.
12 Ideally, a total of 4 sewage samples from all 311 sampling locations would be taken and analysed in order to calculate the average for the previous week.
13 Number of people connected to the number of sampling locations on which the average is based.
30 August 2022 | 16:20
Lower risk of hospital admission after COVID-19 booster jab or repeat vaccination
In the past 8 weeks, from 29 June to 23 August 2022, people aged 12 years and older who had the booster jab had a 51% lower risk of hospital admission than people who only received the basic series of COVID-19 vaccinations, which is a relative risk difference (RRD) of -51%. This means that the risk of hospital admission after a booster jab was about two times lower during this period, compared to people who only received the basic series of vaccinations. The risk of hospital admission for people aged 60 years and older who had the repeat vaccination against COVID-19 was 24% lower than for people who received the booster jab but not the repeat vaccination (RRD -24%).
Read more on the webpage Lower risk of hospital admission after COVID-19 booster jab or repeat vaccination
30 August 2022 | 16:00
Vaccination figures: 22 to 28 August 2022
Up to and including Sunday 28 August, almost 2.7 million repeat vaccinations had been administered. People aged 60 years and older, people living in nursing homes, and people with severely impaired immunity are eligible to get a repeat vaccination against COVID-19 three months after their booster jab or three months after a SARS-CoV-2 infection. Vaccination coverage for the repeat vaccination among people over 60 has now reached 54,2%. From 8 July 2022 on, adults who have not yet had a booster jab or repeat vaccination against COVID-19 received a reminder letter from RIVM.
Read more in the weekly update on COVID-19 vaccination figures.
30 August 2022 | 15:40
Weekly update on the coronavirus SARS-CoV-2: 30 August 2022
As of 17 May 2022, expanded information about the coronavirus SARS-CoV-2 is provided on this page. In addition to figures on positive tests and hospital admissions, the page also includes information from the Infection Radar surveys, sewage surveillance and pathogen surveillance.
Infection Radar, testing, and hospital and ICU admissions
In the Infection Radar survey, the percentage of people who reported possible symptoms of COVID-19 last week remained the same (1.6%) compared to the week before that (1.6%). The number of people who tested positive for COVID-19 reported to the Municipal Public Health Services (GGDs) decreased slightly (-11%) last week compared to the week before that. The number of people who were tested for COVID-19 by the GGD also decreased slightly (-17%). On 15 August 2022, the reproduction number based on reported positive tests was 0.86 (0.81 – 0.92). The number of new hospital admissions of patients with SARS-CoV-2 decreased slightly (-8%) compared to the week before. The number of new ICU admissions of patients with SARS-CoV-2 remained relatively low; there were 20 ICU admissions last week (-26%).
Sewage surveillance
In sewage surveillance, the national average viral load in week 33 (15 – 21 August 2022) remained about the same as in week 31. A similar trend was observed in the first half of week 34 (22 – 24 August). The average number of virus particles was highest in Amsterdam-Amstelland in week 33 and in Limburg-Noord in the first half of week 34. The BA.5 Omicron sub-variant is still observed most frequently.
Virus variants from pathogen surveillance
So far, the Omicron variant has five sub-variants that are currently being monitored closely. These have been designated BA.1, BA.2 (including sub-variants BA.2.12.1 and BA.2.75), BA.3, BA.4 and BA.5.
Since June 2022, Omicron BA.5 has been the dominant variant in the Netherlands (>90% of the tested samples since week 29). According to the WHO, these variants do not appear to cause more serious illness than the BA.2 variant that was recently most prevalent in the Netherlands. However, there are indications that antibodies may be less effective against these variants.
Since July 2022, various countries have recently observed a new sub-variant of the Omicron BA.2 lineage: BA.2.75. This sub-variant has been found in India, Australia, Japan, Canada, the USA, Germany, Denmark and the UK, among other countries. BA.2.75 has been increasing recently in pathogen surveillance in the Netherlands. The next few weeks will show whether this upward trend will continue. It is too early to say whether this will lead to an increase in the number of infections. BA.2.75 seems to have minor specific mutations that enable it to more easily evade the immunity built up against COVID-19 (by vaccination or previous infection). There are no indications that the BA.2.75 sub-variant would be more likely to cause severe illness compared to the other Omicron sub-variants. This sub-variant seems to be increasing slowly in the Netherlands and in the surrounding countries. RIVM will continue monitoring the situation.
| Reports of people tested for SARS-CoV-2 who had a positive test result | 23 August to 30 August1,2 | 16 August to 23 August3,4 |
| Number of newly reported positive tests (by date as published by RIVM) |
7,735 (42 per 100,000 inhabitants) |
8,906 (48 per 100,000 inhabitants) |
| Hospital admissions by calendar week | Week 341 | Week 333 |
|
Total new hospital admissions of patients with SARS-COV-2 (including ICU admissions) New hospital admissions of patients with SARS-CoV-2 (including ICU admissions) not including patients with an admission reason other than SARS-CoV-2 (Source: NICE)5 |
281
238 |
305
267 |
|
Total new ICU admissions of patients with SARS-CoV-2 New ICU admissions not including patients with an admission reason other than SARS-CoV-2 (Source: NICE)5 |
20
15 |
27
23 |
| Reported deaths of people who tested positive for SARS-CoV-2 6 | 23 August to 30 August1,2 | 16 August to 23 August3,4 |
| Deaths | 12 | 31 |
| SARS-CoV-2 tests by the GGD per calendar week | week 347 | week 337 |
| Total number of tests of which results are known Number of positive tests Percentage of positive tests* |
10,372 6,423 |
11,694 7,497 |
| Latest calculation | One week before | |
| Reproduction numbers8 | On 15 August 2022 | On 8 August 2022 |
| Based on reported positive tests | 0,86 (0,81 – 0,92) | 0,88 (0,83 – 0,93) |
| Based on hospital admissions (Source: NICE)9 | 0,82 (0,56 – 1,12) | 0,89 (0,62 – 1,18) |
| Based on ICU admissions (Source: NICE)9 | 0,93 (0,00 – 2,71) | 1,05 (0,00 – 2,71) |
| Last week (first half of the week) | Two weeks ago (first and second half of the week) | |
| Sewage surveillance | Week 34 (22 to 24 August 2022) | Week 33 (15 to 21 August 2022) |
| Average number of virus particles (x 100 billion per 100,000 inhabitants)10 | 569 | 574 |
| Number of sampling locations on which the average is based | 298/31111 | 307/31112 |
| Number of people connected to those sewage treatment plants13 |
16,478,607 |
17,006,836 |
1 As published 30 August 2022 in the weekly epidemiological update on SARS-CoV-2 in the Netherlands.
2 Reports by the Municipal Public Health Services (GGDs) to RIVM between 23 August 2022 10:01 and 30 August2022 10:00.
3As published 23 August 2022 in the weekly epidemiological update on SARS-CoV-2 in the Netherlands.
4 Reports by the Municipal Public Health Services (GGDs) to RIVM between 16 August 2022 10:01 and 23 August 2022 10:00.
5Not all patients admitted to hospital with the coronavirus SARS-CoV-2 have COVID-19 as the main reason or one of the reasons for hospital admission. The hospital and ICU admissions for which it is known that admission was due to other reasons than a SARS-CoV-2 infection (category 3 in the admission reasons) are not counted here. For an explanation of the categories of admission reasons, see the RIVM graphs page, or the weekly epidemiological update on SARS-CoV-2 in the Netherlands.
6 Not all of these reported deaths occurred within the last week. The actual number of deaths is higher than the deaths that are reported in the surveillance. This is because there is no mandatory reporting requirement for death due to COVID-19. For that reason, the mortality figures presented here are underreported.
7 As published 30 August 2022 in the weekly epidemiological update on SARS-CoV-2 in the Netherlands. The figures from the past week and current week may be updated to include any test results provided later. These figures only include tests of people who were tested in the GGD test lanes and does not include any tests that are required in order to travel.
8 For more information about the reproduction number, click here.
9 The reproduction numbers (R) based on NICE data are calculated using hospital and ICU admissions due to COVID-19. These calculations do not include admissions registered by NICE after 25 January 2022 for any reason other than COVID-19.
10 Based on data available at RIVM on Monday afternoon, 29 August 2022, as published in the open data. See the sewage surveillance updates on the Coronavirus Dashboard for the latest figures. See the explanation of the data presented for more details about how these figures are calculated.
11 In the first half of last week, between 1 and 3 samples were taken from each sampling location and analysed. The samples were taken on the Monday, Tuesday and/or Wednesday of that week.
12 Ideally, a total of 4 sewage samples from all 311 sampling locations would be taken and analysed in order to calculate the average for the previous week.
13 Number of people connected to the number of sampling locations on which the average is based.
23 August 2022 | 16:00
Vaccination figures: 15 to 21 August 2022
Up to and including Sunday 21 August, almost 2.7 million repeat vaccinations had been administered. People aged 60 years and older, people living in nursing homes, and people with severely impaired immunity are eligible to get a repeat vaccination against COVID-19 three months after their booster jab or three months after a SARS-CoV-2 infection. Vaccination coverage for the repeat vaccination among people over 60 has now reached 54%. From 8 July 2022 on, adults who have not yet had a booster jab or repeat vaccination against COVID-19 received a reminder letter from RIVM.
Read more in the weekly update on COVID-19 vaccination figures.
23 August 2022 | 15:10
Weekly update on the coronavirus SARS-CoV-2: 23 August 2022
As of 17 May 2022, expanded information about the coronavirus SARS-CoV-2 is provided on this page. In addition to figures on positive tests and hospital admissions, the page also includes information from the Infection Radar surveys, sewage surveillance and pathogen surveillance.
Infection Radar, testing, and hospital and ICU admissions
In the Infection Radar survey, the percentage of people who reported possible symptoms of COVID-19 last week decreased slightly (-1.6%) compared to the week before that (-1.9%). The number of people who tested positive for COVID-19 reported to the Municipal Public Health Services (GGDs) decreased (-24%) last week compared to the week before that. The number of people who were tested for COVID-19 by the GGD also decreased (-17%). On 8 August 2022, the reproduction number based on reported positive tests was 0.88 (0.83 – 0.93). The number of new hospital admissions of patients with SARS-CoV-2 remained the same compared to the week before. The number of new ICU admissions of patients with SARS-CoV-2 also remained stable and relatively low; there were 27 ICU admissions last week, compared to 26 ICU admissions the week before.
Sewage surveillance
In sewage surveillance, the national average viral load in week 32 (8 – 14 August 2022) decreased by 32.9% compared to week 31. In the first half of week 33 (15 – 17 July), the average number of virus particles increased slightly compared to the week before that, rising by 13.4%. In both weeks, the average number of virus particles was highest in Amsterdam-Amstelland. The BA.5 Omicron sub-variant was observed most frequently, while the BA.4 sub-variant was detected less often once again.
Virus variants from pathogen surveillance
So far, the Omicron variant has five sub-variants that are currently being monitored closely. These have been designated BA.1, BA.2 (including sub-variants BA.2.12.1 and BA.2.75), BA.3, BA.4 and BA.5.
Since June 2022, Omicron BA.5 has been the dominant variant in the Netherlands (>90% of the tested samples since week 29). According to the WHO, these variants do not appear to cause more serious illness than the BA.2 variant that was recently most prevalent in the Netherlands. However, there are indications that antibodies may be less effective against these variants.
Since July 2022, various countries have recently observed a new sub-variant of the Omicron BA.2 lineage: BA.2.75. This sub-variant has been found in India, Australia, Japan, Canada, the USA, Germany and the UK, among other countries. This sub-variant has also been detected several times in pathogen surveillance in the Netherlands. Not much is known about BA.2.75 at this point. Like other Omicron sub-variants, BA.2.75 does seem to have minor specific mutations that enable it to more easily evade the immunity built up against COVID-19. For the time being, this sub-variant does not seem to be increasing rapidly or in the Netherlands or in the surrounding countries. RIVM will continue monitoring the situation.
| Reports of people tested for SARS-CoV-2 who had a positive test result | 16 August to 23 August1,2 | 9 August to 16 August3,4 |
| Number of newly reported positive tests (by date as published by RIVM) |
8,906 (48 per 100,000 inhabitants) |
11,688 (63 per 100,000 inhabitants) |
| Hospital admissions by calendar week | Week 331 | Week 323 |
|
Total new hospital admissions of patients with SARS-COV-2 (including ICU admissions) New hospital admissions of patients with SARS-CoV-2 (including ICU admissions) not including patients with an admission reason other than SARS-CoV-2 (Source: NICE)5 |
305
267 |
305
271 |
|
Total new ICU admissions of patients with SARS-CoV-2 New ICU admissions not including patients with an admission reason other than SARS-CoV-2 (Source: NICE)5 |
27
23 |
26
19 |
| Reported deaths of people who tested positive for SARS-CoV-2 6 | 16 August to 23 August1,2 | 9 August to 16 August3,4 |
| Deaths | 31 | 25 |
| SARS-CoV-2 tests by the GGD per calendar week | week 337 | week 327 |
| Total number of tests of which results are known Number of positive tests Percentage of positive tests* |
11,694 7,497 |
14,135 9,416 |
| Latest calculation | One week before | |
| Reproduction numbers8 | On 8 August 2022 | On 1 August 2022 |
| Based on reported positive tests | 0,88 (0,83 – 0,93) | 0,81 (0,77 – 0,85) |
| Based on hospital admissions (Source: NICE)9 | 0,89 (0,62 – 1,18) | 0,79 (0,56 – 1,05) |
| Based on ICU admissions (Source: NICE)9 | 1,05 (0,00 – 2,71) | 0,85 (0,00 – 2,71) |
| Last week (first half of the week) | Two weeks ago (first and second half of the week) | |
| Sewage surveillance | Week 33 (15 to 17 August 2022) | Week 32 (8 to 14 August 2022) |
| Average number of virus particles (x 100 billion per 100,000 inhabitants)10 | 646 | 570 |
| Number of sampling locations on which the average is based | 293/31111 | 307/31112 |
| Number of people connected to those sewage treatment plants13 |
16,322,045 |
17,195,457 |
1 As published 23 August 2022 in the weekly epidemiological update on SARS-CoV-2 in the Netherlands.
2 Reports by the Municipal Public Health Services (GGDs) to RIVM between 16 August 2022 10:01 and 23 August2022 10:00.
3As published 16 August 2022 in the weekly epidemiological update on SARS-CoV-2 in the Netherlands.
4 Reports by the Municipal Public Health Services (GGDs) to RIVM between 9 August 2022 10:01 and 16 August 2022 10:00.
5Not all patients admitted to hospital with the coronavirus SARS-CoV-2 have COVID-19 as the main reason or one of the reasons for hospital admission. The hospital and ICU admissions for which it is known that admission was due to other reasons than a SARS-CoV-2 infection (category 3 in the admission reasons) are not counted here. For an explanation of the categories of admission reasons, see the RIVM graphs page, or the weekly epidemiological update on SARS-CoV-2 in the Netherlands.
6 Not all of these reported deaths occurred within the last week. The actual number of deaths is higher than the deaths that are reported in the surveillance. This is because there is no mandatory reporting requirement for death due to COVID-19. For that reason, the mortality figures presented here are underreported.
7 As published 23 August 2022 in the weekly epidemiological update on SARS-CoV-2 in the Netherlands. The figures from the past week and current week may be updated to include any test results provided later. These figures only include tests of people who were tested in the GGD test lanes and does not include any tests that are required in order to travel.
8 For more information about the reproduction number, click here.
9 The reproduction numbers (R) based on NICE data are calculated using hospital and ICU admissions due to COVID-19. These calculations do not include admissions registered by NICE after 25 January 2022 for any reason other than COVID-19.
10 Based on data available at RIVM on Monday afternoon, 22 August 2022, as published in the open data. See the sewage surveillance updates on the Coronavirus Dashboard for the latest figures. See the explanation of the data presented for more details about how these figures are calculated.
11 In the first half of last week, between 1 and 3 samples were taken from each sampling location and analysed. The samples were taken on the Monday, Tuesday and/or Wednesday of that week.
12 Ideally, a total of 4 sewage samples from all 311 sampling locations would be taken and analysed in order to calculate the average for the previous week.
13 Number of people connected to the number of sampling locations on which the average is based.
16 August 2022 | 17:15
Weekly update on the coronavirus SARS-CoV-2: 16 August 2022
As of 17 May 2022, expanded information about the coronavirus SARS-CoV-2 is provided on this page. In addition to figures on positive tests and hospital admissions, the page also includes information from the Infection Radar surveys, sewage surveillance and pathogen surveillance.
Infection Radar, testing, and hospital and ICU admissions
In the Infection Radar survey, the percentage of people who reported possible symptoms of COVID-19 last week decreased (1.9%) compared to the week before that (2.4%). The number of people who tested positive for COVID-19 reported to the Municipal Public Health Services (GGDs) decreased (-21%) last week compared to the week before that. The number of people who were tested for COVID-19 by the GGD also continued to decrease (-27%). On 1 August 2022, the reproduction number based on reported positive tests was 0.81 (0.77 – 0.85). The number of new hospital admissions of patients with SARS-CoV-2 decreased (-31%) compared to the week before. Although the number of new ICU admissions of patients with SARS-CoV-2 remained relatively low, this figure rose from 23 to 26 (+13%) compared to the week before.
Sewage surveillance
In sewage surveillance, the national average viral load in week 31 (1 – 7 August 2022) decreased by 24% compared to week 30. In sewage surveillance, the national average viral load in week 31 (1 – 7 August 2022) decreased by 24% compared to week 30. In the first half of week 32 (8 – 10 August), the average number of virus particles continued to decrease, dropping by 37%. The average number of virus particles was highest in Haaglanden in week 31 and in Amsterdam-Amstelland in week 32. The BA.5 Omicron sub-variant was observed most frequently, while the BA.4 sub-variant was detected less often once again.
Virus variants from pathogen surveillance
So far, the Omicron variant has five sub-variants that are currently being monitored closely. These have been designated BA.1, BA.2 (including sub-variant BA.2.12.1), BA.3, BA.4 and BA.5.
Since June 2022, Omicron BA.5 has been the dominant variant in the Netherlands (>90% of the tested samples in week 30). According to the WHO, these new variants do not appear to cause more serious illness than the BA.2 variant that was recently most prevalent in the Netherlands. However, there are indications that antibodies may be less effective against these variants.
Since July 2022, various countries have recently observed a new sub-variant of the Omicron BA.2 lineage: BA.2.75. This sub-variant has been found in India, Australia, Japan, Canada, the USA, Germany and the UK, among other countries. This sub-variant has also been detected twice in pathogen surveillance in the Netherlands. Not much is known about BA.2.75 at this point. Like other Omicron sub-variants, BA.2.75 does seem to have minor specific mutations that enable it to more easily evade the immunity built up against COVID-19. For the time being, this sub-variant does not seem to be increasing rapidly or in the Netherlands or in the surrounding countries. RIVM will continue monitoring the situation.
| Reports of people tested for SARS-CoV-2 who had a positive test result | 9 August to 16 August1,2 | 2 August to 9 August3,4 |
| Number of newly reported positive tests (by date as published by RIVM) |
11,688 (63 per 100,000 inhabitants) |
14,878 (80 per 100,000 inhabitants) |
| Hospital admissions by calendar week | Week 321 | Week 313 |
|
Total new hospital admissions of patients with SARS-COV-2 (including ICU admissions) New hospital admissions of patients with SARS-CoV-2 (including ICU admissions) not including patients with an admission reason other than SARS-CoV-2 (Source: NICE)5 |
305
271 |
445
396 |
|
Total new ICU admissions of patients with SARS-CoV-2 New ICU admissions not including patients with an admission reason other than SARS-CoV-2 (Source: NICE)5 |
26
19 |
23
18 |
| Reported deaths of people who tested positive for SARS-CoV-2 6 | 9 August to 16 August1,2 | 2 August to 9 August3,4 |
| Deaths | 25 | 33 |
| SARS-CoV-2 tests by the GGD per calendar week | week 327 | week 317 |
| Total number of tests of which results are known Number of positive tests Percentage of positive tests* |
14,135 9,416 |
19,366 12,982 |
| Latest calculation | One week before | |
| Reproduction numbers8 | On 1 August 2022 | On 25 July 2022 |
| Based on reported positive tests | 0,81 (0,77 – 0,85) | 0,81 (0,78 – 0,85) |
| Based on hospital admissions (Source: NICE)9 | 0,79 (0,56 – 1,05) | 0,81 (0,60 – 1,04) |
| Based on ICU admissions (Source: NICE)9 | 0,85 (0,00 – 2,71) | 0,89 (0,00 – 2,41) |
| Last week (first half of the week) | Two weeks ago (first and second half of the week) | |
| Sewage surveillance | Week 32 (8 to 10 August 2022) | Week 31 (1 to 1 August 2022) |
| Average number of virus particles (x 100 billion per 100,000 inhabitants)10 | 536 | 852 |
| Number of sampling locations on which the average is based | 288/31211 | 306/21212 |
| Number of people connected to those sewage treatment plants13 |
15,981,929 |
17,048,636 |
16 August 2022 | 16:30
Vaccination figures: 8 to 14 August 2022
Up to and including Sunday 14 August, almost 2.7 million repeat vaccinations had been administered. People aged 60 years and older, people living in nursing homes, and people with severely impaired immunity are eligible to get a repeat vaccination against COVID-19 three months after their booster jab or three months after a SARS-CoV-2 infection. Vaccination coverage for the repeat vaccination among people over 60 has now reached 53.7%. From 8 July 2022 on, adults who have not yet had a booster jab or repeat vaccination against COVID-19 received a reminder letter from RIVM.
Read more in the weekly update on COVID-19 vaccination figures.
9 August 2022 | 16:00
Vaccination figures: 1 to 7 August 2022
Up to and including Sunday 7 August, almost 2.6 million repeat vaccinations had been administered. People aged 60 years and older, people living in nursing homes, and people with severely impaired immunity are eligible to get a repeat vaccination against COVID-19 three months after their booster jab or three months after a SARS-CoV-2 infection. Vaccination coverage for the repeat vaccination among people over 60 has now reached 53.2%. From 8 July 2022 on, adults who have not yet had a booster jab or repeat vaccination against COVID-19 received a reminder letter from RIVM.
Read more in the weekly update on COVID-19 vaccination figures.
9 August 2022 | 15:30
Weekly update on the coronavirus SARS-CoV-2: 9 August 2022
As of 17 May 2022, expanded information about the coronavirus SARS-CoV-2 is provided on this page. In addition to figures on positive tests and hospital admissions, the page also includes information from the Infection Radar surveys, sewage surveillance and pathogen surveillance.
Infection Radar, testing, and hospital and ICU admissions
In the Infection Radar survey, the percentage of people who reported possible symptoms of COVID-19 last week remained reasonably stable (2.4%) compared to the week before that (2.7%). The number of people who tested positive for COVID-19 reported to the Municipal Public Health Services (GGDs) decreased (-31%) last week compared to the week before that. The number of people who were tested for COVID-19 by the GGD also decreased (-32%). On 25 July 2022, the reproduction number based on reported positive tests was 0.81 (0.78 – 0.85). The number of new hospital admissions of patients with SARS-CoV-2 decreased (-12%) compared to the week before. The number of new ICU admissions of patients with SARS-CoV-2 remained relatively low, and decreased (-18%) compared to the week before.
Sewage surveillance
In sewage surveillance, the national average viral load in week 30 (25 ¬– 31 July 2022) decreased by 34% compared to week 29. In the first half of week 31 (1 – 3 August), the average number of virus particles continued to decrease, dropping by 19%. The average number of virus particles was highest in Gelderland-Zuid in week 30 and in Limburg-Noord in week 31. The BA.5 Omicron sub-variant was observed most frequently, while the BA.4 sub-variant was detected less often once again.
Virus variants from pathogen surveillance
So far, the Omicron variant has five sub-variants that are currently being monitored closely. These have been designated BA.1, BA.2 (including sub-variant BA.2.12.1), BA.3, BA.4 and BA.5.
Since June 2022, Omicron BA.5 has been the dominant variant in the Netherlands (>90% of the tested samples in week 29). According to the WHO, these new variants do not appear to cause more serious illness than the BA.2 variant that was recently most prevalent in the Netherlands. However, there are indications that antibodies may be less effective against these variants.
Since July 2022, various countries have recently observed a new sub-variant of the Omicron BA.2 lineage: BA.2.75. This sub-variant has been found in India, Australia, Japan, Canada, the USA, Germany and the UK, among other countries. This sub-variant has also been detected once in pathogen surveillance in the Netherlands. Not much is known about BA.2.75 at this point. Like other Omicron sub-variants, BA.2.75 does seem to have minor specific mutations that enable it to more easily evade the immunity built up against COVID-19. For the time being, this sub-variant does not seem to be increasing rapidly or in the Netherlands or in the surrounding countries. RIVM will continue monitoring the situation.
| Reports of people tested for SARS-CoV-2 who had a positive test result | 2 August to 9 August1,2 | 26 July to 2 August3,4 |
| Number of newly reported positive tests (by date as published by RIVM) |
14,878 (80 per 100,000 inhabitants) |
21,680 (119 per 100,000 inhabitants) |
| Hospital admissions by calendar week | Week 311 | Week 303 |
|
Total new hospital admissions of patients with SARS-COV-2 (including ICU admissions) New hospital admissions of patients with SARS-CoV-2 (including ICU admissions) not including patients with an admission reason other than SARS-CoV-2 (Source: NICE)5 |
445
396 |
503
431 |
|
Total new ICU admissions of patients with SARS-CoV-2 New ICU admissions not including patients with an admission reason other than SARS-CoV-2 (Source: NICE)5 |
23
18 |
28
20 |
| Reported deaths of people who tested positive for SARS-CoV-2 6 | 2 August to 9 August1,2 | 26 July to 2 August3,4 |
| Deaths | 33 | 25 |
| SARS-CoV-2 tests by the GGD per calendar week | week 317 | week 307 |
| Total number of tests of which results are known Number of positive tests Percentage of positive tests* |
19,366 12,983 |
28,336 18,931 |
| Latest calculation | One week before | |
| Reproduction numbers8 | On 25 July 2022 | On 18 July 2022 |
| Based on reported positive tests | 0,81 (0,78 – 0,85) | 0,88 (0,84 – 0,91) |
| Based on hospital admissions (Source: NICE)9 | 0,81 (0,60 – 1,04) | 0,83 (0,63 – 1,04) |
| Based on ICU admissions (Source: NICE)9 | 0,89 (0,00 – 2,41) | 0,99 (0,00 – 2,71) |
| Last week (first half of the week) | Two weeks ago (first and second half of the week) | |
| Sewage surveillance | Week 30 (1 to 3 August 2022) | Week 30 (25 to 31 July 2022) |
| Average number of virus particles (x 100 billion per 100,000 inhabitants)10 | 899 | 1108 |
| Number of sampling locations on which the average is based | 292/31211 | 306/21212 |
| Number of people connected to those sewage treatment plants13 |
16,210,461 |
17,070,505 |
2 August 2022 | 17:50
New format for updates on COVID-19 hospital admissions based on vaccination status
The monthly update on COVID-19 hospital admissions and vaccination status will have a different format as of 2 August 2022. From now on, it will compare the risk of hospital admissions between groups that have a different vaccination status.
Read more on the webpage New format for updates on COVID-19 hospital admissions based on vaccination status
2 August 2022 | 16:50
Weekly update on the coronavirus SARS-CoV-2: 2 August 2022
As of 17 May 2022, expanded information about the coronavirus SARS-CoV-2 is provided on this page. In addition to figures on positive tests and hospital admissions, the page also includes information from the Infection Radar surveys, sewage surveillance and pathogen surveillance.
Infection Radar, testing, and hospital and ICU admissions
In the Infection Radar survey, the percentage of people who reported possible symptoms of COVID-19 last week remained stable (2.7%) compared to the week before that (2.7%). The number of people who tested positive for COVID-19 reported to the Municipal Public Health Services (GGDs) decreased (-23%) last week compared to the week before that. Reported infections also continued to decrease in nursing homes. The number of people who were tested for COVID-19 by the GGD decreased (-17%). On 18 July 2022, the reproduction number based on reported positive tests was 0.88 (0.84 – 0.91). The number of new hospital admissions of patients with SARS-CoV-2 decreased (-20%) compared to the week before. The number of new ICU admissions of patients with SARS-CoV-2 remained relatively low, and decreased (-35%) compared to the week before. Although the number of infections still seems fairly high, the downward trends indicate that the summer peak is behind us for now.
Sewage surveillance
In sewage surveillance, the national average viral load in week 29 (18 – 24 July 2022) decreased by 10.0% compared to week 28. Viral loads were highest in and around Amsterdam, Rotterdam and The Hague. In the first half of week 30 (25 – 27 July), the average number of virus particles continued to decrease significantly, dropping by 33.6%. The BA.5 Omicron sub-variant was observed most frequently, while the BA.4 sub-variant was detected less often again.
Virus variants from pathogen surveillance
So far, the Omicron variant has five sub-variants that are currently being monitored closely. These have been designated BA.1, BA.2 (including sub-variant BA.2.12.1), BA.3, BA.4 and BA.5.
Many countries have recently seen an increase in sub-variant BA.5. The percentage of this variant is being monitored in the context of pathogen surveillance and by means of variant PCR. Since June 2022, Omicron BA.5 has been the dominant variant in the Netherlands (90% of the tested samples in week 38).
According to the WHO, these new variants do not appear to cause more serious illness than the BA.2 variant that was recently most prevalent in the Netherlands. However, there are indications that antibodies may be less effective against these variants.
Various countries have recently observed a new sub-variant of the Omicron BA.2 lineage: BA.2.75. This sub-variant has been found in India, Australia, Japan, Canada, the USA, Germany and the UK, among other countries. This sub-variant has been detected once in pathogen surveillance in the Netherlands. Not much is known about BA.2.75 at this point. Like other Omicron sub-variants, BA.2.75 does seem to have minor specific mutations that enable it to more easily evade the immunity built up against COVID-19. RIVM is monitoring the situation very closely.
| Reports of people tested for SARS-CoV-2 who had a positive test result | 26 July to 2 August1,2 | 19 July to 26 July3,4 |
| Number of newly reported positive tests (by date as published by RIVM) |
21,680 (119 per 100,000 inhabitants) |
28,019 (153 per 100,000 inhabitants) |
| Hospital admissions by calendar week | Week 301 | Week 293 |
|
Total new hospital admissions of patients with SARS-COV-2 (including ICU admissions) New hospital admissions of patients with SARS-CoV-2 (including ICU admissions) not including patients with an admission reason other than SARS-CoV-2 (Source: NICE)5 |
503
431 |
631
534 |
|
Total new ICU admissions of patients with SARS-CoV-2 New ICU admissions not including patients with an admission reason other than SARS-CoV-2 (Source: NICE)5 |
28
20 |
43
27 |
| Reported deaths of people who tested positive for SARS-CoV-2 6 | 26 July to 2 August1,2 | 19 July to 26 July3,4 |
| Deaths | 25 | 37 |
| SARS-CoV-2 tests by the GGD per calendar week | week 307 | week 297 |
| Total number of tests of which results are known Number of positive tests Percentage of positive tests* |
28,336 18,931 |
33,950 23,858 |
| Latest calculation | One week before | |
| Reproduction numbers8 | On 18 July 2022 | On 11 July 2022 |
| Based on reported positive tests | 0,88 (0,84 – 0,91) | 0,84 (0,81 – 0,87) |
| Based on hospital admissions (Source: NICE)9 | 0,83 (0,63 – 1,04) | 0,86 (0,67 – 1,06) |
| Based on ICU admissions (Source: NICE)9 | 0,99 (0,00 – 2,71) | 0,92 (0,00 – 2,26) |
| Last week (first half of the week) | Two weeks ago (first and second half of the week) | |
| Sewage surveillance | Week 30 (25 to 27 July 2022) | Week 29 (18 to 24 July 2022) |
| Average number of virus particles (x 100 billion per 100,000 inhabitants)10 | 1115 | 1679 |
| Number of sampling locations on which the average is based | 295/31211 | 307/21212 |
| Number of people connected to those sewage treatment plants13 |
16,375,721 |
17,057,534 |
1 As published 2 August 2022 in the weekly epidemiological update on SARS-CoV-2 in the Netherlands.
2 Reports by the Municipal Public Health Services (GGDs) to RIVM between 26 July2022 10:01 and 2 August2022 10:00.
3As published 26 July 2022 in the weekly epidemiological update on SARS-CoV-2 in the Netherlands.
4 Reports by the Municipal Public Health Services (GGDs) to RIVM between 19 July 2022 10:01 and 26 July 2022 10:00.
5Not all patients admitted to hospital with the coronavirus SARS-CoV-2 have COVID-19 as the main reason or one of the reasons for hospital admission. The hospital and ICU admissions for which it is known that admission was due to other reasons than a SARS-CoV-2 infection (category 3 in the admission reasons) are not counted here. For an explanation of the categories of admission reasons, see the RIVM graphs page, or the weekly epidemiological update on SARS-CoV-2 in the Netherlands.
6 Not all of these reported deaths occurred within the last week. The actual number of deaths is higher than the deaths that are reported in the surveillance. This is because there is no mandatory reporting requirement for death due to COVID-19. For that reason, the mortality figures presented here are underreported.
7 As published 2 August 2022 in the weekly epidemiological update on SARS-CoV-2 in the Netherlands. The figures from the past week and current week may be updated to include any test results provided later. These figures only include tests of people who were tested in the GGD test lanes and does not include any tests that are required in order to travel.
8 For more information about the reproduction number, click here.
9 The reproduction numbers (R) based on NICE data are calculated using hospital and ICU admissions due to COVID-19. These calculations do not include admissions registered by NICE after 25 January 2022 for any reason other than COVID-19.
10 Based on data available at RIVM on Monday afternoon, 1 August 2022, as published in the open data. See the sewage surveillance updates on the Coronavirus Dashboard for the latest figures. See the explanation of the data presented for more details about how these figures are calculated.
11 In the first half of last week, between 1 and 3 samples were taken from each sampling location and analysed. The samples were taken on the Monday, Tuesday and/or Wednesday of that week.
12 Ideally, a total of 4 sewage samples from all 312 sampling locations would be taken and analysed in order to calculate the average for the previous week.
13 Number of people connected to the number of sampling locations on which the average is based.
2 August 2022 | 16:00
Vaccination figures: 25 to 31 July 2022
Up to and including Sunday 31 July, almost 2.6 million repeat vaccinations had been administered. People aged 60 years and older, people living in nursing homes, and people with severely impaired immunity are eligible to get a repeat vaccination against COVID-19 three months after their booster jab or three months after a SARS-CoV-2 infection. Vaccination coverage for the repeat vaccination among people over 60 has now reached 52.2%. Almost 70.000 repeat vaccinations have been administered in the past week. From 8 July 2022 on, adults who have not yet had a booster jab or repeat vaccination against COVID-19 received a reminder letter from RIVM.
Read more in the weekly update on COVID-19 vaccination figures.
26 July 2022 | 16:15
Vaccination figures: 18 to 24 July 2022
Up to and including Sunday 24 July, more than 2.5 million repeat vaccinations had been administered. People aged 60 years and older, people living in nursing homes, and people with severely impaired immunity are eligible to get a repeat vaccination against COVID-19 three months after their booster jab or three months after a SARS-CoV-2 infection. Vaccination coverage for the repeat vaccination among people over 60 has now reached 50.9%. From 8 July 2022 on, adults who have not yet had a booster jab or repeat vaccination against COVID-19 received a reminder letter from RIVM.
Read more in the weekly update on COVID-19 vaccination figures.
26 July 2022 | 16:00
Weekly update on the coronavirus SARS-CoV-2: 26 July 2022
As of 17 May 2022, expanded information about the coronavirus SARS-CoV-2 is provided on this page. In addition to figures on positive tests and hospital admissions, the page also includes information from the Infection Radar surveys, sewage surveillance and pathogen surveillance.
Infection Radar, testing, and hospital and ICU admissions
In the Infection Radar survey, the percentage of people who reported possible symptoms of COVID-19 last week (2.7%) decreased compared to the week before that (3.6%). The number of people who tested positive for COVID-19 reported to the Municipal Public Health Services (GGDs) decreased (-27%) last week compared to the week before that, and the number of people by the GGD also decreased (-33%). On 11 July 2022, the reproduction number based on reported positive tests was 0.84 (0.81 – 0.87). The decrease in tests and reported positive tests may possibly be due in part to the summer period, when many Dutch people are on holiday. However, there is also a decrease in the number of reported positive tests in nursing homes, a figure that is not expected to be affected by holidays (or hardly at all). Looking at hospital figures, the number of new hospital admissions of patients with SARS-CoV-2 decreased slightly, dropping by 12% compared to the week before, while the number of new patients with SARS-CoV-2 in the ICU remained relatively low (+8%) compared to the week before.
Sewage surveillance
In sewage surveillance, the national average viral load in week 28 (11 – 17 July 2022) rose by 17.8% compared to week 27. In the first half of week 29 (18 – 20 July), the average viral load decreased slightly, dropping by 6.8%. In both periods, viral loads were once again highest in and around Amsterdam and The Hague. The BA.5 Omicron sub-variant was observed most frequently in sewage in week 28, while the BA.4 sub-variant was detected less often again.
Virus variants from pathogen surveillance
More than 80% of all samples examined in week 27 (4 – 10 July) contained the BA.5 sub-variant. This variant became dominant in the Netherlands in June 2022. So far, the BA.2.75 sub-variant has only been found once during pathogen surveillance: in a sample taken in week 25 (20 – 26 June).
| Reports of people tested for SARS-CoV-2 who had a positive test result | 19 July t/m 26 July1,2 | 12 July t/m 19 July3,4 |
| Number of newly reported positive tests (by date as published by RIVM) |
28,019 (153 per 100,000 inhabitants) |
38,470 (212 per 100,000 inhabitants) |
| Hospital admissions by calendar week | Week 291 | Week 283 |
|
Total new hospital admissions of patients with SARS-COV-2 (including ICU admissions) New hospital admissions of patients with SARS-CoV-2 (including ICU admissions) not including patients with an admission reason other than SARS-CoV-2 (Source: NICE)5 |
631
534 |
721
638 |
|
Total new ICU admissions of patients with SARS-CoV-2 New ICU admissions not including patients with an admission reason other than SARS-CoV-2 (Source: NICE)5 |
43
27 |
40
30 |
| Reported deaths of people who tested positive for SARS-CoV-2 6 | 19 July t/m 26 July1,2 | 12 July t/m 19 July3,4 |
| Deaths | 37 | 30 |
| SARS-CoV-2 tests by the GGD per calendar week | week 297 | week 287 |
| Total number of tests of which results are known Number of positive tests Percentage of positive tests* |
33,949 23,857 |
49,936 35,495 |
| Latest calculation | One week before | |
| Reproduction numbers8 | On 11 July 2022 | On 4 July 2022 |
| Based on reported positive tests | 0,84 (0,81 – 0,87) | 0,99 (0,96 – 1,03) |
| Based on hospital admissions (Source: NICE)9 | 0,86 (0,67 – 1,06) | 0,97 (0,77 – 1,20) |
| Based on ICU admissions (Source: NICE)9 | 0,92 (0,00 – 2,26)) | 0,98 (0,00 – 2,26) |
| Last week (first half of the week) | Two weeks ago (first and second half of the week) | |
| Sewage surveillance | Week 29 (18 to 20 July 2022) | Week 28 (11 to 17 July 2022) |
| Average number of virus particles (x 100 billion per 100,000 inhabitants)10 | 1740 | 1866 |
| Number of sampling locations on which the average is based | 293/31211 | 30721212 |
| Number of people connected to those sewage treatment plants13 |
16,367,454 |
17,225,305 |
19 July 2022 | 16:00
Vaccination figures: 11 to 17 July 2022
Up to and including Sunday 17 July, more than 2.4 million repeat vaccinations had been administered. People aged 60 years and older, people living in nursing homes, and people with severely impaired immunity are eligible to get a repeat vaccination against COVID-19 three months after their booster jab or three months after a SARS-CoV-2 infection. Vaccination coverage for the repeat vaccination among people over 60 has now reached 49.3%. Over 100,000 repeat vaccinations were administered last week. This is the highest number of repeat vaccinations in one week within the past three months. The strongest increase was seen among people in their 70s and 80s. Those age groups received twice as many repeat vaccinations last week compared to the week before that. From 8 July 2022 on, adults who have not yet had a booster jab or repeat vaccination against COVID-19 received a reminder letter from RIVM.
Read more in the weekly update on COVID-19 vaccination figures.
19 July 2022 | 15:30
Weekly update on the coronavirus SARS-CoV-2: 19 July 2022
As of 17 May 2022, expanded information about the coronavirus SARS-CoV-2 is provided on this page. In addition to figures on positive tests and hospital admissions, the page also includes information from the Infection Radar surveys, sewage surveillance and pathogen surveillance.
Infection Radar, testing, and hospital and ICU admissions
In the Infection Radar survey, the percentage of people who reported possible symptoms of COVID-19 last week (3.6%) was comparable to the week before that (3.7%). The number of people who tested positive for COVID-19 reported to the Municipal Public Health Services (GGDs) decreased slightly (-11%) last week compared to the week before that. The number of people who were tested for COVID-19 also decreased slightly (-6%). On 4 July 2022, the reproduction number based on reported positive tests was 0.99 (0.96 – 1.03). However, the number of new hospital admissions of patients with SARS-CoV-2 increased 29% compared to the week before. Although the number of new ICU admissions of patients with SARS-CoV-2 remained relatively low and table (-7%) compared to the week before.
Sewage surveillance
In sewage surveillance, the national average viral load in week 27 (4 – 10 July) remained about the same as in week 26, dropping only slightly (-2.8%). In the first half of week 28 (11 – 13 July), the average viral load increased again, rising by 14.6%. In both weeks, viral loads were once again highest in the metropolitan area, particularly in and around Amsterdam. The BA.5 Omicron sub-variant was observed most frequently in sewage in week 27. The BA.4 sub-variant was found to a much lesser extent, and the BA.2.12.1 sub-variant seems to be gradually disappearing.
Virus variants from pathogen surveillance
The percentage of the BA.5 sub-variant, which became dominant in June 2022, is still increasing. Various countries have recently observed a sub-variant of the Omicron BA.2 lineage: BA.2.75. This sub-variant has been found in India, Australia, Japan, Canada, the USA, Germany and the UK, among other countries. BA.2.75 has also been found in the Netherlands by now.
| Reports of people tested for SARS-CoV-2 who had a positive test result | 12 July t/m 19 July1,2 | 5 July t/m 12 July3,4 |
| Number of newly reported positive tests (by date as published by RIVM) |
38,470 (212 per 100,000 inhabitants) |
43,220 (2242per 100,000 inhabitants) |
| Hospital admissions by calendar week | Week 281 | Week 273 |
|
Total new hospital admissions of patients with SARS-COV-2 (including ICU admissions) New hospital admissions of patients with SARS-CoV-2 (including ICU admissions) not including patients with an admission reason other than SARS-CoV-2 (Source: NICE)5 |
721
638 |
561
495 |
|
Total new ICU admissions of patients with SARS-CoV-2 New ICU admissions not including patients with an admission reason other than SARS-CoV-2 (Source: NICE)5 |
40
30 |
43
35 |
| Reported deaths of people who tested positive for SARS-CoV-2 6 | 12 July t/m 19 July1,2 | 5 July t/m 12 July3,4 |
| Deaths | 30 | 17 |
| SARS-CoV-2 tests by the GGD per calendar week | week 287 | week 277 |
| Total number of tests of which results are known Number of positive tests Percentage of positive tests* |
49,938 35,497 |
52,916 7,869 |
| Latest calculation | One week before | |
| Reproduction numbers8 | On 4 July 2022 | On 27 June 2022 |
| Based on reported positive tests | 0.99 (0.96 – 1.03) | 1.01 (0.97 – 1.05) |
| Based on hospital admissions (Source: NICE)9 | 0.97 (0.77 – 1.20) | 0.96 (0.75 – 1.19) |
| Based on ICU admissions (Source: NICE)9 | 0.98 (0.00 – 2.26) | 1.11 (0.00 – 2.71)) |
| Last week (first half of the week) | Two weeks ago (first and second half of the week) | |
| Sewage surveillance | Week 28 (11 to 13 July 2022) | Week 27 (4 to 11 July 2022) |
| Average number of virus particles (x 100 billion per 100,000 inhabitants)10 | 1795 | 1567 |
| Number of sampling locations on which the average is based | 287/31211 | 310/21212 |
| Number of people connected to those sewage treatment plants13 |
16,444,664 |
17,306,272 |
12 July 2022 | 16:00
Vaccination figures: 4 to 10 July 2022
Up to and including Sunday 10 July, more than 2.3 million repeat vaccinations had been administered. People aged 60 years and older, people living in nursing homes, and people with severely impaired immunity are eligible to get a repeat vaccination against COVID-19 three months after their booster jab or three months after a SARS-CoV-2 infection. Vaccination coverage for the repeat vaccination among people over 60 has now reached 47.3%.
Read more in the weekly update on COVID-19 vaccination figures.
12 July 2022 | 15:50
Weekly update on the coronavirus SARS-CoV-2: 12 July 2022
As of 17 May 2022, expanded information about the coronavirus SARS-CoV-2 is provided on this page. In addition to figures on positive tests and hospital admissions, the page also includes information from the Infection Radar surveys, sewage surveillance and pathogen surveillance.
Read more on the webpage Weekly coronavirus SARS-CoV-2 figures.
5 July 2022 | 16:15
COVID-19 booster jab and repeat vaccination needed for older people to restore protection
In the period from 15 March 2022 to 28 June 2022, hardly any protection against hospital and ICU admission could still be detected from the basic series of COVID-19 vaccinations. This is because the vast majority of people who only received the basic series were vaccinated nearly a year ago by now, and vaccinations (and previous infections) provide protection against hospital admission which diminishes over time.
Read more: COVID-19 booster jab and repeat vaccination needed for older people to restore protection
5 July 2022 | 16:00
Vaccination figures: 27 June – 3 July 2022
Up to and including Sunday 3 July, more than 2.2 million repeat vaccinations had been administered. People aged 60 years and older, people living in nursing homes, and people with severely impaired immunity are eligible to get a repeat vaccination against COVID-19 three months after their booster jab or three months after a SARS-CoV-2 infection. Vaccination coverage for the repeat vaccination among people over 60 has now reached 47.1%. For the past 3 weeks, the weekly number of repeat vaccinations has been increasing. More than twice as many repeat vaccinations were administered last week compared to the week of 6 June. The strongest increase was seen among people aged 60-69 years.
Read more in the weekly update on COVID-19 vaccination figures.
5 July 2022 | 15:30
Weekly update on the coronavirus SARS-CoV-2: 5 July 2022
As of 17 May 2022, expanded information about the coronavirus SARS-CoV-2 is provided on this page. In addition to figures on positive tests and hospital admissions, the page also includes information from the Infection Radar surveys, sewage surveillance and pathogen surveillance. For more background information see the news: SARS-CoV-2 infections rising less rapidly.
28 June 2022 | 16:50
Weekly update on the coronavirus SARS-CoV-2: 28 June 2022
As of 17 May 2022, expanded information about the coronavirus SARS-CoV-2 is provided on this page. In addition to figures on positive tests and hospital admissions, the page also includes information from the Infection Radar surveys, sewage surveillance and pathogen surveillance. For more background information see the news: SARS-CoV-2 infections continue to rise.
Infection Radar, testing, and hospital and ICU admissions
In the Infection Radar survey last week, the percentage of people who reported possible symptoms of COVID-19 stabilised at about 3.5%. The number of people who were tested for COVID-19 and the number of newly reported positive COVID-19 tests increased (+29%) last week compared to the week before that. This increase was observed in all age groups and in all security regions. On 13 June 2022, the reproduction number based on reported positive tests was above 1. The number of new hospital admissions of patients with SARS-CoV-2 increased 7%, while the number of new patients with SARS-CoV-2 in the ICU rose 10%, compared to the week before.
Sewage surveillance
In sewage surveillance, an increase of 49.2% was observed in the national average number of virus particles in week 24 compared to week 23. Once again, viral loads were highest in the metropolitan area, particularly in and around Amsterdam. In the first half of week 25, the average number of virus particles continued to increase, rising by 30.3%; at that time, those levels were particularly high in and around The Hague. The Omicron sub-variant BA.2 is still present in sewage, but the BA.5 Omicron sub-variant was observed most frequently in week 24. The BA.4 sub-variant was found to a lesser extent, and the BA.2.12.1 sub-variant continued to decrease significantly.
Virus variants from pathogen surveillance
So far, the Omicron variant has five sub-variants that are currently being monitored closely. These have been designated BA.1, BA.2 (including sub-variant BA.2.12.1), BA.3, BA.4 and BA.5. Many countries have recently seen an increase in sub-variants BA.4 and BA.5. BA.2.12.1 is also increasing in some countries. The data from pathogen surveillance shows that BA.5 became dominant in the Netherlands in June 2022. Saltro’s variant PCR data shows the same trend.
According to the WHO, these new variants do not appear to cause more serious illness than the BA.2 variant that was recently most prevalent in the Netherlands. However, there are indications that antibodies may be less effective against these variants.
| Last week | Two weeks ago | |
|---|---|---|
| Reports of people tested for SARS-CoV-2 who had a positive test result | ||
| Number of newly reported positive tests (by date as published by RIVM) |
34,1451 (192 per 100,000 inhabitants) |
26.4622 (149 per 100,000 inhabitants) |
|
Total new hospital admissions of patients with SARS-COV-2 (including ICU admissions)3 New hospital admissions of patients with SARS-CoV-2 (including ICU admissions) not including patients with an admission reason other than SARS-CoV-2 (Source: NICE)3,4 |
437
374 |
408
337 |
|
Total new ICU admissions of patients with SARS-CoV-23 New ICU admissions not including patients with an admission reason other than SARS-CoV-2 (Source: NICE)3,4 |
32
21 |
29
25 |
| Deaths5 | 15 | 11 |
| SARS-CoV-2 tests by the GGD per calendar week6 | week 25 | week 24 |
| Total number of tests of which results are known Number of positive tests Percentage of positive tests* |
42,247 29,571 |
32,042 21,856 |
| Latest calculation | One week before | |
| Reproduction numbers7 | On 13 June 2022 | On 6 juni 2022 |
| Based on reported positive tests | 1,16 (1,10 – 1,22) | 1,25 (1,17 – 1,34) |
| Based on hospital admissions (Source: NICE)8 | 1,06 (0,77 – 1,37) | 1,01 (0,68 – 1,38) |
| Based on ICU admissions (Source: NICE)8 | 1,10 (0,00 – 2,71) | 1,14 (0,00 – 2,71) |
| Last week (first half of the week) | Two weeks ago (first and second half of the week) | |
| Sewage surveillance | Week 25 (20 to 22 June 2022) | Week 24 (13 to 19 June 2022) |
| Average number of virus particles (x 100 billion per 100,000 inhabitants)9 | 1256 | 964 |
| Number of sampling locations on which the average is based | 298 / 31210 | 308 / 31211 |
| Number of people connected to those sewage treatment plants12 |
16,668,672 |
17,215,260 |
GGD reports to RIVM between 21 June 2022 10:01 and 28June 2022 10:00 as published 28 June 2022 in the weekly epidemiological update on SARS-CoV-2 in the Netherlands.
2 GGD reports to RIVM between 14 June 2022 10:01 and 21 June 2022 10:00 as published 21 June 2022 in the weekly epidemiological update on SARS-CoV-2 in the Netherlands.
3 As published 28 June 2022 in the weekly epidemiological update on SARS-CoV-2 in the Netherlands. The figures may be updated to include any registrations provided later by the NICE Foundation, especially regarding the past week and the week before that.
4Not all patients admitted to hospital with the coronavirus SARS-CoV-2 have COVID-19 as the main reason or one of the reasons for hospital admission. The hospital and ICU admissions for which it is known that admission was due to other reasons than a SARS-CoV-2 infection (category 3 in the admission reasons) are not counted here. For an explanation of the categories of admission reasons, see the RIVM graphs page, or the weekly epidemiological update on SARS-CoV-2 in the Netherlands.
5 Not all of these reported deaths occurred within the last week. The actual number of deaths is higher than the deaths that are reported in the surveillance. This is because there is no mandatory reporting requirement for death due to COVID-19. For that reason, the mortality figures presented here are underreported.
6 As published 28 June 2022 in the weekly epidemiological update on SARS-CoV-2 in the Netherlands. The figures from the past week and current week may be updated to include any test results provided later. These figures only include tests of people who were tested in the GGD test lanes and does not include any tests that are required in order to travel.
7 For more information about the reproduction number, click here.
8 The reproduction numbers (R) based on NICE data are calculated using hospital and ICU admissions due to COVID-19. These calculations do not include admissions registered by NICE after 25 January 2022 for any reason other than COVID-19.
9 Based on data available at RIVM on Monday afternoon, 27 June 2022, as published in the open data. See the sewage surveillance updates on the Coronavirus Dashboard for the latest figures. See the explanation of the data presented for more details about how these figures are calculated.
10 In the first half of last week, between 1 and 3 samples were taken from each sampling location and analysed. The samples were taken on the Monday, Tuesday and/or Wednesday of that week.
11 Ideally, a total of 4 sewage samples from all 312 sampling locations would be taken and analysed in order to calculate the average for the previous week.
12 Number of people connected to the number of sampling locations on which the average is based.
28 June 2022 | 16:30
Vaccination figures: 20 June – 26 June 2022
Up to and including Sunday 26 June 2022, more than 2.2 million repeat vaccinations had been administered. People aged 60 years and older, people living in nursing homes, and people with severely impaired immunity are eligible to get a repeat vaccination against COVID-19 three months after their booster jab or three months after a SARS-CoV-2 infection. Vaccination coverage for the repeat vaccination among people over 60 has now reached 45.7%. For the past two weeks, the weekly number of repeat vaccinations has been increasing. 59% more repeat vaccinations were administered last week compared to the week of 6 June. The strongest increase was seen in the age group of people aged 60 to 70 years.
Read more in the weekly update on COVID-19 vaccination figures.
21 June 2022 | 16:30
Weekly update on the coronavirus SARS-CoV-2: 21 June 2022
As of 17 May 2022, expanded information about the coronavirus SARS-CoV-2 is provided on this page. In addition to figures on positive tests and hospital admissions, the page also includes information from the Infection Radar surveys, sewage surveillance and pathogen surveillance.
For more information read the news: Upward trend in infections continues
Infection Radar, testing, and hospital and ICU admissions
In the Infection Radar survey last week, the percentage of people who reported possible symptoms of COVID-19 continued rising to above 3%. The number of people who were tested for COVID-19 and the number of newly reported positive COVID-19 tests increased significantly (+70%) last week compared to the week before that. This increase was observed in all age groups and in all security regions. On 6 June 2022, the reproduction number based on reported positive tests was above 1. The number of new hospital admissions of patients with SARS-CoV-2 stabilised, but the number of new patients with SARS-CoV-2 in the ICU rose by 37%, compared to the week before.
Sewage surveillance
In sewage surveillance, an increase of 37.6% was observed in the national average number of virus particles in week 23 compared to week 22. As in last week’s update, the average number of virus particles was particularly high in and around Amsterdam and The Hague. In the first half of week 24, the average number of virus particles continued to increase, rising by 34.1%. The Omicron sub-variant BA.2 is still very present in sewage, but a significant increase in the number of sewage samples containing mutations specifically associated with BA.5 was observed again in week 23. The BA.4 mutations were found to a lesser extent, and there was a significant decrease in the mutations specific to BA.2.12.1.
Virus variants from pathogen surveillance
So far, the Omicron variant has five sub-variants that are currently being monitored closely. These have been designated BA.1, BA.2 (including sub-variant BA.2.12.1), BA.3, BA.4 and BA.5. Many countries have recently seen an increase in sub-variants BA.4 and BA.5. BA.2.12.1 is also increasing in some countries. Based on the latest pathogen surveillance data, trend forecasts for Omicron sub-variants BA.4, BA.5 and BA.2.12.1 suggest that BA.5 will become dominant. Saltro’s variant PCR data shows a comparable trend, indicating that the combined percentage of BA.4/BA.5 became dominant in early June.
| Last week | Two weeks ago | |
|---|---|---|
| Reports of people tested for SARS-CoV-2 who had a positive test result | ||
| Number of newly reported positive tests (by date as published by RIVM) |
26,4621 (149 per 100,000 inhabitants) |
15,5262 (87 per 100,000 inhabitants) |
|
Total new hospital admissions of patients with SARS-COV-2 (including ICU admissions)3 New hospital admissions of patients with SARS-CoV-2 (including ICU admissions) not including patients with an admission reason other than SARS-CoV-2 (Source: NICE)3,4 |
312
268 |
311
258 |
|
Total new ICU admissions of patients with SARS-CoV-23 New ICU admissions not including patients with an admission reason other than SARS-CoV-2 (Source: NICE)3,4 |
26
22 |
19
16 |
| Deaths5 | 11 | 10 |
| SARS-CoV-2 tests by the GGD per calendar week6 | week 24 | week 23 |
| Total number of tests of which results are known Number of positive tests Percentage of positive tests* |
32,042 21,856 |
18,241 11,938 |
| Latest calculation | One week before | |
| Reproduction numbers7 | On 6 June 2022 | On 30 May 2022 |
| Based on reported positive tests | 1,25 (1,17 – 1,22) | 1,13 (1,04 – 1,22) |
| Based on hospital admissions (Source: NICE)8 | 1,01 (0,68 – 1,38) | 0,99 (0,60 – 1,45) |
| Based on ICU admissions (Source: NICE)8 | 1,14 (0,00 – 2,71) | 1,14 (0,00 – 3,16) |
| Last week (first half of the week) | Two weeks ago (first and second half of the week) | |
| Sewage surveillance | Week 24 (13 to 15 June 2022) | Week 23 (6 to 12 June 2022) |
| Average number of virus particles (x 100 billion per 100,000 inhabitants)9 | 868 | 647 |
| Number of sampling locations on which the average is based | 299 / 31210 | 306 / 31211 |
| Number of people connected to those sewage treatment plants12 |
16,778,050 |
17,137,783 |
1 GGD reports to RIVM between 14 June 2022 10:01 and 21 June 2022 10:00 as published 21 June 2022 in the weekly epidemiological update on SARS-CoV-2 in the Netherlands.
2 GGD reports to RIVM between 7 June 2022 10:01 and 14 June 2022 10:00 as published 14 June 2022 in the weekly epidemiological update on SARS-CoV-2 in the Netherlands.
3 As published 21 June 2022 in the weekly epidemiological update on SARS-CoV-2 in the Netherlands. The figures may be updated to include any registrations provided later by the NICE Foundation, especially regarding the past week and the week before that.
4Not all patients admitted to hospital with the coronavirus SARS-CoV-2 have COVID-19 as the main reason or one of the reasons for hospital admission. The hospital and ICU admissions for which it is known that admission was due to other reasons than a SARS-CoV-2 infection (category 3 in the admission reasons) are not counted here. For an explanation of the categories of admission reasons, see the RIVM graphs page, or the weekly epidemiological update on SARS-CoV-2 in the Netherlands.
5 Not all of these reported deaths occurred within the last week. The actual number of deaths is higher than the deaths that are reported in the surveillance. This is because there is no mandatory reporting requirement for death due to COVID-19. For that reason, the mortality figures presented here are underreported.
6 As published 21 June 2022 in the weekly epidemiological update on SARS-CoV-2 in the Netherlands. The figures from the past week and current week may be updated to include any test results provided later. These figures only include tests of people who were tested in the GGD test lanes and does not include any tests that are required in order to travel.
7 For more information about the reproduction number, click here.
8 The reproduction numbers (R) based on NICE data are calculated using hospital and ICU admissions due to COVID-19. These calculations do not include admissions registered by NICE after 25 January 2022 for any reason other than COVID-19.
9 Based on data available at RIVM on Monday afternoon, 20 June 2022, as published in the open data. See the sewage surveillance updates on the Coronavirus Dashboard for the latest figures. See the explanation of the data presented for more details about how these figures are calculated.
10 In the first half of last week, between 1 and 3 samples were taken from each sampling location and analysed. The samples were taken on the Monday, Tuesday and/or Wednesday of that week.
11 Ideally, a total of 4 sewage samples from all 312 sampling locations would be taken and analysed in order to calculate the average for the previous week.
12 Number of people connected to the number of sampling locations on which the average is based.
21 June 2022 | 16:00
Vaccination figures: 13 June – 19 June 2022
Up to and including Sunday 19 June 2022, more than 2.1 million repeat vaccinations had been administered. People aged 60 years and older, people living in nursing homes, and people with severely impaired immunity are eligible to get a repeat vaccination against COVID-19 three months after their last COVID-19 vaccination or three months after a SARS-CoV-2 infection. Vaccination coverage for the repeat vaccination among people over 60 has now reached 44.2%.
Read more in the weekly update on COVID-19 vaccination figures.
14 June 2022 | 19:30
Weekly update on the coronavirus SARS-CoV-2: 14 June 2022
As of 17 May 2022, expanded information about the coronavirus SARS-CoV-2 is provided on this page. In addition to figures on positive tests and hospital admissions, the page also includes information from the Infection Radar surveys, sewage surveillance and pathogen surveillance.
More information : read the news Many more infections, limited increase in hospital admissions
Infection Radar, testing, and hospital and ICU admissions
In the Infection Radar survey last week,the percentage of people who reported possible symptoms of COVID-19 continued to increase, rising to over 3%. The number of people who were tested for COVID-19 and the number of newly reported positive COVID-19 tests increased significantly (+64%) last week compared to the week before that. This increase was observed in all age groups and security regions. On 30 May 2022, the reproduction number based on reported positive tests was above 1. The number of new hospital admissions of patients with SARS-CoV-2 increased by 12% and the number of new patients with SARS-CoV-2 in the ICU remained the same, compared to the week before.
Sewage surveillance
In sewage surveillance, an increase of +62.4% was observed in the national average number of virus particles in week 22 compared to week 21. The average number of virus particles was particularly high in and around Amsterdam and The Hague, In the first half of week 22, the average number of virus particles continued to increase, rising by +37,3%. The Omicron sub-variant BA.2 is still very present in sewage, but from week 20 on, there was a significant increase in the number of sewage samples containing mutations specifically associated with BA.4, BA.5 and BA.2.12.1. In weeks 21 and 22, the upward trend seemed to continue in particular for the specific mutations associated with sub-variant BA.5.
Virus variants from pathogen surveillance
So far, the Omicron variant has five sub-variants that are currently being monitored closely. These have been designated BA.1, BA.2 (including sub-variant BA.2.12.1), BA.3, BA.4 and BA.5. However, it is currently very unclear which Omicron sub-variant is spreading fastest and will become dominant. Based on the latest pathogen surveillance data and the variant PCR data, there has been an increase in BA.4 and BA.4; the variant PCR provides slightly more up-to-date data. Based on this variant PCR data, these two sub-variants represented over half of total numbers by the end of last week. In addition to BA.4 and BA.5, pathogen surveillance also shows an increase in a BA.2 sub-variant, BA.2.12.1.
1 GGD reports to RIVM between 7 June 2022 10:01 and 14 June 2022 10:00 as published 14 June 2022 in the weekly epidemiological update on SARS-CoV-2 in the Netherlands.
2 GGD reports to RIVM between 31 May 2022 10:01 and 7 June 2022 10:00 as published 7 June 2022 in the weekly epidemiological update on SARS-CoV-2 in the Netherlands.
3 As published 14 June 2022 in the weekly epidemiological update on SARS-CoV-2 in the Netherlands. The figures may be updated to include any registrations provided later by the NICE Foundation, especially regarding the past week and the week before that.
4Not all patients admitted to hospital with the coronavirus SARS-CoV-2 have COVID-19 as the main reason or one of the reasons for hospital admission. The hospital and ICU admissions for which it is known that admission was due to other reasons than a SARS-CoV-2 infection (category 3 in the admission reasons) are not counted here. For an explanation of the categories of admission reasons, see the RIVM graphs page, or the weekly epidemiological update on SARS-CoV-2 in the Netherlands.
5 Not all of these reported deaths occurred within the last week. The actual number of deaths is higher than the deaths that are reported in the surveillance. This is because there is no mandatory reporting requirement for death due to COVID-19. For that reason, the mortality figures presented here are underreported.
6 As published 14 June 2022 in the weekly epidemiological update on SARS-CoV-2 in the Netherlands. The figures from the past week and current week may be updated to include any test results provided later. These figures only include tests of people who were tested in the GGD test lanes and does not include any tests that are required in order to travel.
7 For more information about the reproduction number, click here.
8 The reproduction numbers (R) based on NICE data are calculated using hospital and ICU admissions due to COVID-19. These calculations do not include admissions registered by NICE after 25 January 2022 for any reason other than COVID-19.
9 Based on data available at RIVM on Monday afternoon, 13 June 2022, as published in the open data. See the sewage surveillance updates on the Coronavirus Dashboard for the latest figures. See the explanation of the data presented for more details about how these figures are calculated.
10 In the first half of last week, between 1 and 3 samples were taken from each sampling location and analysed. The samples were taken on the Monday, Tuesday and/or Wednesday of that week.
11 Ideally, a total of 4 sewage samples from all 312 sampling locations would be taken and analysed in order to calculate the average for the previous week.
12 Number of people connected to the number of sampling locations on which the average is based.
14 June 2022 | 16:00
Vaccination figures: 6 June – 12 June 2022
Up to and including Sunday 12 June 2022, more than 2 million repeat vaccinations had been administered. People aged 60 years and older, people living in nursing homes, and people with severely impaired immunity are eligible to get a repeat vaccination against COVID-19 three months after their last COVID-19 vaccination or three months after a SARS-CoV-2 infection. Vaccination coverage for the repeat vaccination among people over 60 has now reached 43.1%.
See: Archive COVID-19 vaccination figures 2022
7 June 2022 | 15:40 PM
Weekly update on the coronavirus SARS-CoV-2: 7 June 2022
As of 17 May 2022, expanded information about the coronavirus SARS-CoV-2 is provided on this page. In addition to figures on positive tests and hospital admissions, the page also includes information from the Infection Radar surveys, sewage surveillance and pathogen surveillance.
Infection Radar, testing, and hospital and ICU admissions
In the Infection Radar survey last week, the percentage of people who reported possible symptoms of COVID-19 rose from about 2% to about 3%. The number of people who were tested for COVID-19 and the number of newly reported positive COVID-19 tests increased (+33%) last week compared to the week before that. This increase was observed in all age groups, except among children aged 0-12 years, and the largest increase was among people aged 13-29 years. On 19 May 2022, the reproduction number based on reported positive tests was around 1. The number of new hospital admissions of patients with SARS-CoV-2 decreased by 23% and the number of new patients with SARS-CoV-2 in the ICU stabilised, compared to the week before.
Sewage surveillance
In sewage surveillance, a slight decrease of -8.7% was observed in the national average number of virus particles in week 21 compared to week 20. In the first two days of week 22, the average number of virus particles increased slightly again, rising by +7.8%. Sewage surveillance figures seem to have plateaued for the time being. However, the average number of virus particles in and around the major cities (Amsterdam, Rotterdam, The Hague) is high compared to the rest of the Netherlands. The Omicron sub-variant BA.2 is still very present in sewage, but in week 20, there was a significant increase in the number of sewage samples containing mutations specifically associated with BA.4, BA.5 and BA.2.12.1. In week 21, the upward trend seemed to continue in particular for the specific mutations associated with sub-variants BA.5 and BA.2.12.1.
Virus variants from pathogen surveillance
So far, the Omicron variant has five sub-variants that are currently being monitored closely. These have been designated BA.1, BA.2, BA.3, BA.4 and BA.5. The BA.2 sub-variant is currently dominant in the Netherlands. The percentage of sub-variants BA.4, BA.5 and BA.2.12.1, a sub-variant of BA.2, is increasing in pathogen surveillance. However, it is currently very unclear which Omicron sub-variant is spreading fastest and will become dominant. BA.4 and BA.5 differ in some respects, but have the same changes in the spike protein, and are therefore likely to have very similar properties. BA.2.12.1 has another change in the spike protein. There is currently no reason to believe that any of these sub-variants would cause a more severe course of disease.
| Last week | Two weeks ago | |
|---|---|---|
| Reports of people tested for SARS-CoV-2 who had a positive test result | ||
| Number of newly reported positive tests (by date as published by RIVM) |
9,4591 (53 per 100,000 inhabitants) |
7,0882 (39 per 100,000 inhabitants) |
|
Total new hospital admissions of patients with SARS-COV-2 (including ICU admissions)3 New hospital admissions of patients with SARS-CoV-2 (including ICU admissions) not including patients with an admission reason other than SARS-CoV-2 (Source: NICE)3,4 |
128
108 |
167
140 |
|
Total new ICU admissions of patients with SARS-CoV-23 New ICU admissions not including patients with an admission reason other than SARS-CoV-2 (Source: NICE)3,4 |
14
13 |
14
8 |
| Deaths5 | 3 | 13 |
| SARS-CoV-2 tests by the GGD per calendar week6 | week 22 | week 21 |
| Total number of tests of which results are known Number of positive tests Percentage of positive tests* |
13.084 7.782 |
9.992 5.288 |
| Latest calculation | One week before | |
| Reproduction numbers7 | On 19 May 2022 | On 16 May 2022 |
| Based on reported positive tests | 0,99 (0,91 - 1,07) | 0,89 (0,82 - 0,95) |
| Based on hospital admissions (Source: NICE)8 | 0,88 (0,49 - 1,35) | 0,80 (0,43 - 1,22) |
| Based on ICU admissions (Source: NICE)8 | 1,08 (0,00 - 3,31) | 0,83 (0,00 - 2,71) |
| Last week (first half of the week) | Two weeks ago (first and second half of the week) | |
| Sewage surveillance | Week 22 (30 to 31 May 2022) | Week 21 (23 to 29 May 2022) |
| Average number of virus particles (x 100 billion per 100,000 inhabitants)9 | 301 | 279 |
| Number of sampling locations on which the average is based | 236 / 31210 | 305 / 31211 |
| Number of people connected to those sewage treatment plants12 | 14,151,238 | 17,037,272 |
1 GGD reports to RIVM between 31 May 2022 10:01 and 7 June 2022 10:00 as published 7 June 2022 in the weekly epidemiological update on SARS-CoV-2 in the Netherlands.
2 GGD reports to RIVM between 24 May 2022 10:01 and 31 May 2022 10:00 as published 31 May 2022 in the weekly epidemiological update on SARS-CoV-2 in the Netherlands.
3 As published 7 June 2022 in the weekly epidemiological update on SARS-CoV-2 in the Netherlands. The figures may be updated to include any registrations provided later by the NICE Foundation, especially regarding the past week and the week before that.
4Not all patients admitted to hospital with the coronavirus SARS-CoV-2 have COVID-19 as the main reason or one of the reasons for hospital admission. The hospital and ICU admissions for which it is known that admission was due to other reasons than a SARS-CoV-2 infection (category 3 in the admission reasons) are not counted here. For an explanation of the categories of admission reasons, see the RIVM graphs page, or the weekly epidemiological update on SARS-CoV-2 in the Netherlands.
5 Not all of these reported deaths occurred within the last week. The actual number of deaths is higher than the deaths that are reported in the surveillance. This is because there is no mandatory reporting requirement for death due to COVID-19. For that reason, the mortality figures presented here are underreported.
6 As published 7 June 2022 in the weekly epidemiological update on SARS-CoV-2 in the Netherlands. The figures from the past week and current week may be updated to include any test results provided later. These figures only include tests of people who were tested in the GGD test lanes and does not include any tests that are required in order to travel.
7 For more information about the reproduction number, click here.
8 The reproduction numbers (R) based on NICE data are calculated using hospital and ICU admissions due to COVID-19. These calculations do not include admissions registered by NICE after 25 January 2022 for any reason other than COVID-19.
9 Based on data available at RIVM on Monday afternoon, 6 June 2022, as published in the open data. See the sewage surveillance updates on the Coronavirus Dashboard for the latest figures. See the explanation of the data presented for more details about how these figures are calculated.
10 In the first half of last week, between 1 and 3 samples were taken from each sampling location and analysed. The samples were taken on the Monday, Tuesday and/or Wednesday of that week.
11 Ideally, a total of 4 sewage samples from all 312 sampling locations would be taken and analysed in order to calculate the average for the previous week.
12 Number of people connected to the number of sampling locations on which the average is based.
31 May 2022 | 16:10 PM
Weekly update on the coronavirus SARS-CoV-2: 31 May 2022
As of 17 May 2022, expanded information about the coronavirus SARS-CoV-2 is provided on this page. In addition to figures on positive tests and hospital occupancy, the page also includes information from the Infection Radar surveys, sewage surveillance and pathogen surveillance.
Infection Radar, testing, and hospital and ICU admissions
In the Infection Radar survey last week, , there was a stabilisation in the percentage of people who reported possible symptoms of COVID-19. . The number of newly reported positive COVID-19 tests recorded by the Municipal Public Health Services (GGDs) decreased slightly (-5%) last week compared to the week before that. The reproduction number is below 1. The number of new hospital admissions of patients with SARS-CoV-2 decreased by 31% and the number of new patients with SARS-CoV-2 in the ICU decreased by 22%, compared to the week before.
Sewage surveillance
In sewage surveillance, a very slight increase of +3.5% was observed in the national average number of virus particles in week 20 compared to week 19. In the first half of week 21, the average number of virus particles decreased slightly again, dropping by -3.6%; sewage surveillance figures seem to have plateaued. In weeks 18 and 19, an increasing number of sewage samples were found to contain mutations associated with the Omicron sub-variants BA.4, BA.5 and BA.2.12.1. In week 20, there was a significant increase in the number of sewage samples containing specific mutations associated with BA.4, BA.5 and BA.2.12.1. At five sampling locations, BA.5 was the most common variant in the sewage sample.
Virus variants from pathogen surveillance
A continued increase in BA.4 and BA.5 has been observed in recent weeks in the context of pathogen surveillance.
Based on pathogen surveillance, trend forecasts for these sub-variants suggest that they may become dominant in June 2022. The increase in BA.4 and BA.5 is also being monitored in cooperation with Saltro by means of variant PCR. Variant PCR data can be accessed sooner and offers an indication for whether the BA.4/5 sub-variants are present, although this method does not detect their presence with certainty; sequencing is performed to confirm which variant is involved. Trend forecasts for BA.4 and BA.5 based on this more recent variant PCR data suggest that these sub-variants may become dominant as soon as early June 2022. However, the margins of uncertainty are still significant.
Some countries have observed an increase in a BA.2 sub-variant, designated BA.2.12.1. This sub-variant is also increasing in pathogen surveillance, but has not been included in the current forecast. This sub-variant cannot be distinguished from BA.2 based on Saltro’s variant PCR data. Which Omicron sub-variant is spreading fastest is currently unclear.
| Last week | Two weeks ago | |
|---|---|---|
| Reports of people tested for SARS-CoV-2 who had a positive test result | ||
| Number of newly reported positive tests (by date as published by RIVM) |
7,0881 (39 per 100,000 inhabitants) |
7,4562 (41 per 100,000 inhabitants) |
|
Total new hospital admissions of patients with SARS-COV-2 (including ICU admissions)3 New hospital admissions of patients with SARS-CoV-2 (including ICU admissions) not including patients with an admission reason other than SARS-CoV-2 (Source: NICE)3,4 |
154
126 |
223
174 |
|
Total new ICU admissions of patients with SARS-CoV-23 New ICU admissions not including patients with an admission reason other than SARS-CoV-2 (Source: NICE)3,4 |
14
8 |
18
13 |
| Deaths5 | 13 | 12 |
| SARS-CoV-2 tests by the GGD per calendar week6 | week 21 | week 20 |
| Total number of tests of which results are known Number of positive tests Percentage of positive tests* |
9,990 5,286 |
11,728 6,041 |
| Latest calculation | One week before | |
| Reproduction numbers7 | On 16 May 2022 | On 9 May 2022 |
| Based on reported positive tests | 0,89 (0,82 - 0,95) | 0,88 (0,83 - 0,93) |
| Based on hospital admissions (Source: NICE)8 | 0,80 (0,43 - 1,22) | 0,85 (0,51 - 1,25) |
| Based on ICU admissions (Source: NICE)8 | 0,83 (0,00 - 2,71) | 0,92 (0,00 - 2,71) |
| Last week (first half of the week) | Two weeks ago (first and second half of the week) | |
| Sewage surveillance | Week 21 (23 to 25 May 2022) | Week 20 (16 to 22 May 2022) |
| Average number of virus particles (x 100 billion per 100,000 inhabitants)9 | 295 | 306 |
| Number of sampling locations on which the average is based | 230 / 31210 | 307 / 31211 |
| Number of people connected to those sewage treatment plants12 | 14,706,501 | 17,130,180 |
1 GGD reports to RIVM between 24 May 2022 10:01 and 31 May 2022 10:00 as published 31 May 2022 in the weekly epidemiological update on SARS-CoV-2 in the Netherlands.
2 GGD reports to RIVM between 17 May 2022 10:01 and 24 May 2022 10:00 as published 24 May 2022 in the weekly epidemiological update on SARS-CoV-2 in the Netherlands.
3 As published 31 May 2022 in the weekly epidemiological update on SARS-CoV-2 in the Netherlands. The figures may be updated to include any registrations provided later by the NICE Foundation, especially regarding the past week and the week before that.
4Not all patients admitted to hospital with the coronavirus SARS-CoV-2 have COVID-19 as the main reason or one of the reasons for hospital admission. The hospital and ICU admissions for which it is known that admission was due to other reasons than a SARS-CoV-2 infection (category 3 in the admission reasons) are not counted here. For an explanation of the categories of admission reasons, see the RIVM graphs page, or the weekly epidemiological update on SARS-CoV-2 in the Netherlands.
5 Not all of these reported deaths occurred within the last week. The actual number of deaths is higher than the deaths that are reported in the surveillance. This is because there is no mandatory reporting requirement for death due to COVID-19. For that reason, the mortality figures presented here are underreported.
6 As published 31 May 2022 in the weekly epidemiological update on SARS-CoV-2 in the Netherlands. The figures from the past week and current week may be updated to include any test results provided later. These figures only include tests of people who were tested in the GGD test lanes and does not include any tests that are required in order to travel.
7 For more information about the reproduction number, click here.
8 The reproduction numbers (R) based on NICE data are calculated using hospital and ICU admissions due to COVID-19. These calculations do not include admissions registered by NICE after 25 January 2022 for any reason other than COVID-19.
9 Based on data available at RIVM on Monday afternoon, 30 May 2022, as published in the open data. See the sewage surveillance updates on the Coronavirus Dashboard for the latest figures. See the explanation of the data presented for more details about how these figures are calculated.
10 In the first half of last week, between 1 and 3 samples were taken from each sampling location and analysed. The samples were taken on the Monday, Tuesday and/or Wednesday of that week.
11 Ideally, a total of 4 sewage samples from all 312 sampling locations would be taken and analysed in order to calculate the average for the previous week.
12 Number of people connected to the number of sampling locations on which the average is based.
31 May 2022 | 16:00
Vaccination figures: 23 to 29 May 2022
Up to and including Sunday 29 May, more than 2 million repeat vaccinations had been administered in the Netherlands. People aged 60 years and older, people living in nursing homes, and people with severely impaired immunity are eligible to get a repeat vaccination against COVID-19 three months after their last COVID-19 vaccination or three months after a SARS-CoV-2 infection. Vaccination coverage for the repeat vaccination among people over 60 has now reached 41.8%.
See: Archive COVID-19 vaccination figures 2022
24 May 2022 | 15:30 PM
Weekly update on the coronavirus SARS-CoV-2: 24 May 2022
As of 17 May 2022, expanded information about the coronavirus SARS-CoV-2 is provided on this page. In addition to figures on positive tests and hospital occupancy, the page also includes information from the Infection Radar surveys, sewage surveillance and pathogen surveillance.
Infection Radar, testing, and hospital and ICU admissions
In the Infection Radar survey last week, , there was a stabilisation in the percentage of people who reported possible symptoms of COVID-19. The number of newly reported positive COVID-19 tests decreased (-11%) last week compared to the week before that. The reproduction number is below 1. The number of new hospital admissions of patients with SARS-CoV-2 decreased by 18% and the number of new patients with SARS-CoV-2 in the ICU stabilised, compared to the week before.
Sewage surveillance
In sewage surveillance, a decrease of 15.7% was observed in the national average viral load in week 19 compared to week 18. In the first half of week 20, the average viral load continued to decrease slightly, dropping 6.3%. Omicron variant BA.2 had been the main variant found in the sewage samples in the past few weeks. In weeks 18 and 19, an increasing number of samples were found to contain shared BA.4/BA.5 mutations, as well as more specific mutations associated with BA.4 and BA.5. BA.2.12.1 was also detected in more samples.
Virus variants from pathogen surveillance
An increase in BA.4 and BA.5 has been observed in recent weeks in the context of pathogen surveillance. Trend forecasts for these sub-variants suggests that they may become dominant in July 2022. However, the margins of uncertainty are still very significant. Since BA.4 and BA.5 are currently only showing up in low numbers in pathogen surveillance, it is not yet possible to predict which of these two sub-variants will become dominant. For that reason, the current forecast displays these two together as BA.4/BA.5.
Some countries have observed an increase in a BA.2 sub-variant, designated BA.2.12.1. This sub-variant has also been detected in pathogen surveillance, but has not been included in the current forecast. Which sub-variant is spreading fastest is currently unclear.
| Last week | Two weeks ago | |
|---|---|---|
| Reports of people tested for SARS-CoV-2 who had a positive test result | ||
| Number of newly reported positive tests (by date as published by RIVM) |
7,4561 (41 per 100,000 inhabitants) |
8,3722 (46 per 100,000 inhabitants) |
|
Total new hospital admissions of patients with SARS-COV-2 (including ICU admissions)3 New hospital admissions of patients with SARS-CoV-2 (including ICU admissions) not including patients with an admission reason other than SARS-CoV-2 (Source: NICE)3,4 |
197
158 |
241
193 |
|
Total new ICU admissions of patients with SARS-CoV-23 New ICU admissions not including patients with an admission reason other than SARS-CoV-2 (Source: NICE)3,4 |
18
12 |
18
12 |
| Deaths5 | 12 | 16 |
| SARS-CoV-2 tests by the GGD per calendar week6 | week 20 | week 19 |
| Total number of tests of which results are known Number of positive tests Percentage of positive tests* |
11,729 6,042 |
13,151 6,922 |
| Latest calculation | One week before | |
| Reproduction numbers7 | On 9 May 2022 | On 2 May 2022 |
| Based on reported positive tests | 0,88 (0,83 - 0,93) | 0,89 (0,85 - 0,94) |
| Based on hospital admissions (Source: NICE)8 | 0,85 (0,51 - 1,25) | 0,79 (0,49 - 1,14) |
| Based on ICU admissions (Source: NICE)8 | 0,92 (0,00 - 2,71) | 0,81 (0,00 - 2,71) |
| Last week (first half of the week) | Two weeks ago (first and second half of the week) | |
| Sewage surveillance | Week 20 (16 to 18 May 2022) | Week 19 (9 to 15 May 2022) |
| Average number of virus particles (x 100 billion per 100,000 inhabitants)9 | 277 | 296 |
| Number of sampling locations on which the average is based | 268 / 31210 | 311 / 31211 |
| Number of people connected to those sewage treatment plants12 | 14,993,916 | 17,339,858 |
1 GGD reports to RIVM between 17 May 2022 10:01 and 24 May 2022 10:00 as published 24 May 2022 in the weekly epidemiological update on SARS-CoV-2 in the Netherlands.
2 GGD reports to RIVM between 10 May 2022 10:01 and 17 May 2022 10:00 as published 17 May 2022 in the weekly epidemiological update on SARS-CoV-2 in the Netherlands.
3 As published 24 May 2022 in the weekly epidemiological update on SARS-CoV-2 in the Netherlands. The figures may be updated to include any registrations provided later by the NICE Foundation, especially regarding the past week and the week before that.
4Not all patients admitted to hospital with the coronavirus SARS-CoV-2 have COVID-19 as the main reason or one of the reasons for hospital admission. The hospital and ICU admissions for which it is known that admission was due to other reasons than a SARS-CoV-2 infection (category 3 in the admission reasons) are not counted here. For an explanation of the categories of admission reasons, see the RIVM graphs page, or the weekly epidemiological update on SARS-CoV-2 in the Netherlands.
5 Not all of these reported deaths occurred within the last week. The actual number of deaths is higher than the deaths that are reported in the surveillance. This is because there is no mandatory reporting requirement for death due to COVID-19. For that reason, the mortality figures presented here are underreported.
6 As published 24 May 2022 in the weekly epidemiological update on SARS-CoV-2 in the Netherlands. The figures from the past week and current week may be updated to include any test results provided later. These figures only include tests of people who were tested in the GGD test lanes and does not include any tests that are required in order to travel.
7 For more information about the reproduction number, click here.
8 The reproduction numbers (R) based on NICE data are calculated using hospital and ICU admissions due to COVID-19. These calculations do not include admissions registered by NICE after 25 January 2022 for any reason other than COVID-19.
9 Based on data available at RIVM on Monday afternoon, 23 May 2022, as published in the open data. See the sewage surveillance updates on the Coronavirus Dashboard for the latest figures. See the explanation of the data presented for more details about how these figures are calculated.
10 In the first half of last week, between 1 and 3 samples were taken from each sampling location and analysed. The samples were taken on the Monday, Tuesday and/or Wednesday of that week.
11 Ideally, a total of 4 sewage samples from all 312 sampling locations would be taken and analysed in order to calculate the average for the previous week.
12 Number of people connected to the number of sampling locations on which the average is based.
17 May 2022 | 16:15
Vaccination figures: 9 to 15 May 2022
Up to and including Sunday 15 May, more than 1.9 million repeat vaccinations had been administered. People aged 60 years and older, people living in nursing homes, and people with severely impaired immunity are eligible to get a repeat vaccination against COVID-19 three months after their last COVID-19 vaccination or three months after a SARS-CoV-2 infection. Vaccination coverage for the repeat vaccination among people over 60 has now reached 39.9%.
Read more in the weekly update on COVID-19 vaccination figures.
17 May 2022 | 16:15 PM
Weekly update on the coronavirus SARS-CoV-2: 17 May 2022
As of today (17 May 2022), we are expanding the information on this page about the coronavirus SARS-CoV-2. In addition to figures on positive tests and hospital occupancy, we will also be adding information from the Infection Radar surveys, sewage surveillance and pathogen surveillance.
Infection Radar, testing, and hospital and ICU admissions
In the Infection Radar survey last week, there was a drop in the percentage of people who reported possible symptoms of COVID-19. The number of newly reported positive COVID-19 tests decreased (16%) last week compared to the week before that. The reproduction number is also below 1. The number of new hospital admissions of patients with SARS-CoV-2 decreased by 31% and the number of new patients with SARS-CoV-2 in the ICU also decreased by 26%, compared to the week before.
Sewage surveillance
In week 18, the national average for virus particles in sewage increased slightly, rising by 7.1% compared to week 17. In the first half of week 19, the average number of virus particles decreased by 21.0%.
Omicron variant BA.2 was the main variant found in the sewage samples. Looking at the sub-variants of BA.2, samples primarily contained the sub-variant BA.2.9, to a lesser extent BA.2.3 and in a few cases BA.2.12. The number of sewage samples with BA.4/BA.5 mutations increased this week compared to last week.
Virus variants from pathogen surveillance
In recent weeks, Omicron variant BA.2 has been the most prevalent. This variant was found in 98% of all samples sequenced in weeks 16 and 17. Omicron BA.4 was detected 3 times: in weeks 14, 15 and 16. Omicron BA.5 was detected once in week 16 and twice in week 17.
| Last week | Two weeks ago | |
|---|---|---|
| Reports of people tested for SARS-CoV-2 who had a positive test result | ||
| Number of newly reported positive tests (by date as published by RIVM) |
8,3721 (46 per 100,000 inhabitants) |
10,0072 (55 per 100,000 inhabitants) |
|
Total new hospital admissions of patients with SARS-COV-2 (including ICU admissions)3 New hospital admissions of patients with SARS-CoV-2 (including ICU admissions) not including patients with an admission reason other than SARS-CoV-2 (Source: NICE)3,4 |
215
172 |
311
252 |
|
Total new ICU admissions of patients with SARS-CoV-23 New ICU admissions not including patients with an admission reason other than SARS-CoV-2 (Source: NICE)3,4 |
17
11 |
23
19 |
| Deaths5 | 16 | 19 |
| SARS-CoV-2 tests by the GGD per calendar week6 | week 19 | week 18 |
| Total number of tests of which results are known Number of positive tests Percentage of positive tests* |
13,152 6,923 |
15,465 8,248 |
| Latest calculation | One week before | |
| Reproduction numbers7 | On 2 May 2022 | On 25 April 2022 |
| Based on reported positive tests | 0,89 (0,85 - 0,94) | 0,95 (0,90 - 1,00) |
| Based on hospital admissions (Source: NICE)8 | 0,79 (0,49 - 1,14) | 0,78 (0,49 - 1,11) |
| Based on ICU admissions (Source: NICE)8 | 0,81 (0,00 - 2,71) | 0,82 (0,00 - 2,71) |
| Last week (first half of the week) | Two weeks ago (first and second half of the week) | |
| Sewage surveillance | Week 19 (9 to 11 May) | Week 18 (2 to 8 May) |
| Average number of virus particles (x 100 billion per 100,000 inhabitants)9 | 273 | 345 |
| Number of sampling locations on which the average is based | 233 / 31210 | 310 / 31211 |
| Number of people connected to those sewage treatment plants12 | 13,401,926 |
17,192,117 |
1 Not all patients admitted to hospital with the coronavirus SARS-CoV-2 have COVID-19 as the main reason or one of the reasons for hospital admission. Current figures on hospital admissions of patients with SARS-CoV-2 categorised by admission reason can be viewed on the RIVM graphs page, or in the weekly epidemiological update on SARS-CoV-2 in the Netherlands.
1 GGD reports to RIVM between 10 May 2022 10:01 and 17 May 2022 10:00 as published 17 May 2022 in the weekly epidemiological update on SARS-CoV-2 in the Netherlands.
2 GGD reports to RIVM between 3 May 2022 10:01 and 10 May 2022 10:00 as published 10 May 2022 in the weekly epidemiological update on SARS-CoV-2 in the Netherlands.
3 As published 17 May 2022 in the weekly epidemiological update on SARS-CoV-2 in the Netherlands. The figures may be updated to include any registrations provided later by the NICE Foundation, especially regarding the past week and the week before that.
4Not all patients admitted to hospital with the coronavirus SARS-CoV-2 have COVID-19 as the main reason or one of the reasons for hospital admission. The hospital and ICU admissions for which it is known that admission was due to other reasons than a SARS-CoV-2 infection (category 3 in the admission reasons) are not counted here. For an explanation of the categories of admission reasons, see the RIVM graphs page, or the weekly epidemiological update on SARS-CoV-2 in the Netherlands.
5 Not all of these reported deaths occurred within the last week. The actual number of deaths is higher than the deaths that are reported in the surveillance. This is because there is no mandatory reporting requirement for death due to COVID-19. For that reason, the mortality figures presented here are underreported.
6 As published 17 May 2022 in the weekly epidemiological update on SARS-CoV-2 in the Netherlands. The figures from the past week and current week may be updated to include any test results provided later. These figures only include tests of people who were tested in the GGD test lanes and does not include any tests that are required in order to travel.
7 For more information about the reproduction number, click here.
8 The reproduction numbers (R) based on NICE data are calculated using hospital and ICU admissions due to COVID-19. These calculations do not include admissions registered by NICE after 25 January 2022 for any reason other than COVID-19.
9 Based on data available at RIVM on Monday afternoon, 16 May 2022, as published in the open data. See the sewage surveillance updates on the Coronavirus Dashboard for the latest figures. See the explanation of the data presented for more details about how these figures are calculated.
10 In the first half of last week, between 1 and 3 samples were taken from each sampling location and analysed. The samples were taken on the Monday, Tuesday and/or Wednesday of that week.
11 Ideally, a total of 4 sewage samples from all 312 sampling locations would be taken and analysed in order to calculate the average for the previous week.
12 Number of people connected to the number of sampling locations on which the average is based.
11 May 2022 | 16:00
Repeat vaccination restores protection against hospital admission to level shortly after booster
In the period from 1 February 2022 to 3 May 2022, vaccine effectiveness of the repeat vaccination against COVID-19 in preventing hospital admission was 88%. In the same period, vaccine effectiveness in preventing hospital admission was 78% among people aged 70 years and older who had received the booster jab but not the repeat vaccination, and 37% among people who had only received the basic series of COVID-19 vaccinations.
Read more: Repeat vaccination restores protection against hospital admission to level shortly after booster
11 May 2022 | 8:30
Vaccination figures: 2 to 8 May 2022
Up to and including Sunday 8 May, more than 1.8 million repeat vaccinations had been administered. People aged 60 years and older, people living in nursing homes, and people with severely impaired immunity are eligible to get a repeat vaccination against COVID-19 three months after their last COVID-19 vaccination or three months after a SARS-CoV-2 infection. Vaccination coverage for the repeat vaccination among people over 60 has now reached 38.9%.
Read more in the weekly update on COVID-19 vaccination figures.
10 May 2022 | 15:00 PM
Weekly update on the coronavirus SARS-CoV-2: 3 May to 10 May 2022
ast week, the number of new hospital admissions of patients1 with SARS-CoV-2 decreased by 28% and the number of new patients with SARS-CoV-2 in the ICU also decreased by 32%, compared to the week before. The number of newly reported COVID-19 tests decreased slightly (-6%) compared to the week before.
The reproduction number is below 1. See the Coronavirus Dashboard for graphs and information on the SARS-CoV-2 situation. Information on the SARS-CoV-2 situation in the Netherlands can also be found on the graphs page and in the epidemiological report, which is updated every week on Tuesdays.
| Last week | Two weeks ago | |
|---|---|---|
| Reports of people tested for SARS-CoV-2 who had a positive test result | ||
| Number of newly reported positive tests (by date as published by RIVM) |
10,0072 (55 per 100,000 inhabitants) |
15,5963 (57 per 100,000 inhabitants) |
|
Total new hospital admissions of patients with SARS-COV-2 (including ICU admissions)3 New hospital admissions of patients with SARS-CoV-2 (including ICU admissions) not including patients with an admission reason other than SARS-CoV-2 (Source: NICE)3,4 |
259
211 |
362
287 |
|
Total new ICU admissions of patients with SARS-CoV-23 New ICU admissions not including patients with an admission reason other than SARS-CoV-2 (Source: NICE)4,5 |
21
18 |
31
20 |
| Deaths6 | 19 | 28 |
| SARS-CoV-2 tests by the GGD per calendar week7,8 | week 18 | week 17 |
| Total number of tests of which results are known Number of positive tests Percentage of positive tests* |
15,466 8,258 |
16,130 8,266 |
| Number of tests intended to confirm a positive self-test9 Number of positive tests after a positive self-test Percentage of positive tests after a positive self-test |
6.587 5,844 |
6.517 5.799 89,0% |
| Number of tests not intended to confirm a positive self-test10 Number of positive tests not after a positive self-test Percentage of positive tests not after a positive self-test |
5,932 1,102 18.6% |
6,633 1,247 18.8% |
|
Number of tests for which it is unknown whether it was a confirmation test8 |
2,947 1,302 44.2% |
2,980 1,220 40.9% |
| Latest calculation | One week before | |
| Reproduction numbers11 | On 25 April 2022 | On 18 April 2022 |
| Based on reported positive tests | 0,95 (0,90 - 1,00) | 0,72 (0,69 - 0,75) |
| Based on hospital admissions (Source: NICE)12 | 0,78 (0,49 - 1,11) | 0,77 (0,54 - 1,04) |
| Based on ICU admissions (Source: NICE)12 | 0,82 (0,00 - 2,71) | 0,82 (0,00 - 1,99) |
03 May 2022 | 16:00
Vaccination figures: 25 April to 1 May 2022
Up to and including Sunday 1 May, more than 1.8 million repeat vaccinations had been administered. People aged 60 years and older, people living in nursing homes, and people with severely impaired immunity are eligible to get a repeat vaccination against COVID-19 three months after their last COVID-19 vaccination or three months after a SARS-CoV-2 infection. Vaccination coverage for the repeat vaccination among people over 60 has now reached 37.7%.
Read more in the weekly update on COVID-19 vaccination figures.
3 May 2022 | 15:00 PM
Weekly update on the coronavirus SARS-CoV-2: 26 april to 3 May 2022
Last week, the number of new hospital admissions of patients1 with SARS-CoV-2 decreased by 40% and the number of new patients with SARS-CoV-2 in the ICU also decreased by 40%, compared to the week before. The number of newly reported positive COVID-19 tests was also lower (-34%) last week compared to the week before that.
The reproduction number is below 1. See the Coronavirus Dashboard for graphs and information on the SARS-CoV-2 situation. Information on the SARS-CoV-2 situation in the Netherlands can also be found on the graphs page and in the epidemiological report, which is updated every week on Tuesdays.
| Last week | Two weeks ago | |
|---|---|---|
| Reports of people tested for SARS-CoV-2 who had a positive test result | ||
| Number of newly reported positive tests (by date as published by RIVM) |
10.5962 (57 per 100.000 inhabitants) |
16.0543 (88 per 100.000 inhabitants) |
|
Total new hospital admissions of patients with SARS-COV-2 (including ICU admissions)3 New hospital admissions of patients with SARS-CoV-2 (including ICU admissions) not including patients with an admission reason other than SARS-CoV-2 (Source: NICE)3,4 |
315
249 |
522
435 |
|
Total new ICU admissions of patients with SARS-CoV-23 New ICU admissions not including patients with an admission reason other than SARS-CoV-2 (Source: NICE)4,5 |
30
21 |
50
42 |
| Deaths6 | 28 | 66 |
| SARS-CoV-2 tests by the GGD per calendar week7,8 | week 17 | week 16 |
| Total number of tests of which results are known Number of positive tests Percentage of positive tests* |
16,130 8,266 |
24,755 13,618 |
| Number of tests intended to confirm a positive self-test9 Number of positive tests after a positive self-test Percentage of positive tests after a positive self-test |
6.517 5,799 |
10,876 9,738 89,5% |
| Number of tests not intended to confirm a positive self-test10 Number of positive tests not after a positive self-test Percentage of positive tests not after a positive self-test |
6,633 1,247 18.8% |
9,788 2,021 20.6% |
|
Number of tests for which it is unknown whether it was a confirmation test8 |
4,980 1,220 40.9% |
4,091 1,859 45.4% |
| Latest calculation | One week before | |
| Reproduction numbers11 | On 18 April 2022 | On 11 April 2022 |
| Based on reported positive tests | 0,72 (0,69 - 0,75) | 0,64 (0,62 - 0,67) |
| Based on hospital admissions (Source: NICE)12 | 0,77 (0,54 - 1,04) | 0,80 (0,59 - 1,03) |
| Based on ICU admissions (Source: NICE)12 | 0,82 (0,00 - 1,99) | 0,92 (0,18 - 1,99) |
26 April 2022 | 16:15
Protection from repeat vaccination remains effective against severe COVID-19
In the period from 1 February 2022 to 19 April 2022, vaccine effectiveness of the basic series of COVID-19 vaccinations in preventing hospital admission was 30%. After the booster jab, that percentage was 79%.
Read the news: Protection from repeat vaccination remains effective against severe COVID-19
26 April 2022 | 16:00
Vaccination figures 18-24 April 2022
Up to and including Sunday 24 April, more than 1.7 million repeat vaccinations had been administered. People aged 60 years and older, people living in nursing homes, and people with severely impaired immunity are eligible to get a repeat vaccination against COVID-19 three months after their last COVID-19 vaccination or three months after a SARS-CoV-2 infection. Vaccination coverage for the repeat vaccination among people over 60 has now reached 35.8%.
Read more in the weekly update on COVID-19 vaccination figures.
26 April 2022 | 16:00 PM
Weekly update on the coronavirus SARS-CoV-2: 19 April to 26 april 2022
Last week, the number of new hospital admissions of patients1 with SARS-CoV-2 decreased by 35% and the number of new patients with SARS-CoV-2 in the ICU decreased by 29%, compared to the week before. The number of newly reported positive COVID-19 tests was also lower (-35%) last week compared to the week before that.
The reproduction number is below 1. See the Coronavirus Dashboard for graphs and information on the SARS-CoV-2 situation. Information on the SARS-CoV-2 situation in the Netherlands can also be found on the graphs page and in the epidemiological report, which is updated every week on Tuesdays.
From Saturday, 9 April 2022, no data will be published on weekends and public holidays* (days off). This is in line with the current situation regarding the coronavirus SARS-CoV-2. RIVM continues to monitor the development of the virus closely.
*Public holidays on which data will not be reported: New Year’s Day, Easter Sunday and Easter Monday, King’s Day, Liberation Day, Ascension Day, Whit Sunday and Whit Monday, Christmas Day and Boxing Day (in 2022: Saturday 1 January, Sunday 17 and Monday 18 April, Wednesday 27 April, Thursday 5 May, Thursday 26 May, Sunday 5 June and Monday 6 June, Sunday 25 and Monday 26 December).
| Last week | Two weeks ago | |
|---|---|---|
| Reports of people tested for SARS-CoV-2 who had a positive test result | ||
| Number of newly reported positive tests (by date as published by RIVM) |
16,0542 (88 per 100.000 inhabitants) |
24,7073 (137 per 100.000 inhabitants) |
|
Total new hospital admissions of patients with SARS-COV-2 (including ICU admissions)3 New hospital admissions of patients with SARS-CoV-2 (including ICU admissions) not including patients with an admission reason other than SARS-CoV-2 (Source: NICE)3,4 |
448
374 |
686
544 |
|
Total new ICU admissions of patients with SARS-CoV-23 New ICU admissions not including patients with an admission reason other than SARS-CoV-2 (Source: NICE)4,5 |
42
37 |
59
44 |
| Deaths6 | 66 | 52 |
| SARS-CoV-2 tests by the GGD per calendar week7,8 | week 16 | week 15 |
| Total number of tests of which results are known Number of positive tests Percentage of positive tests* |
24,755 13,618 |
41,359 24,150 |
| Number of tests intended to confirm a positive self-test9 Number of positive tests after a positive self-test Percentage of positive tests after a positive self-test |
10,876 9,738 89.5% |
18,719 17,058 91.1% |
| Number of tests not intended to confirm a positive self-test10 Number of positive tests not after a positive self-test Percentage of positive tests not after a positive self-test |
9,787 2,020 20.6% |
15,774 3,777 23.9% |
|
Number of tests for which it is unknown whether it was a confirmation test8 |
4,092 1,860 45.5% |
6,866 3,315 48.3% |
| Latest calculation | One week before | |
| Reproduction numbers11 | On 11 April 2022 | On 31 March 2022** |
| Based on reported positive tests | 0,64 (0,62 - 0,67) | 0,71 (0,70 – 0,73) |
| Based on hospital admissions (Source: NICE)12 | 0,80 (0,59 - 1,03) | 0,89 (0,71 – 1,08) |
| Based on ICU admissions (Source: NICE)12 | 0,92 (0,18 - 1,99) | 1,02 (0,30 – 1,99) |
19 April 2022 | 16:00
Vaccination figures 11-17 April 2022
Up to and including Sunday 17 April, more than 1.5 million repeat vaccinations had been administered. People aged 60 years and older, people living in nursing homes, and people with severely impaired immunity are eligible to get a repeat vaccination against COVID-19 three months after their last COVID-19 vaccination or three months after a SARS-CoV-2 infection. Vaccination coverage for the repeat vaccination among people over 60 has reached 32.7%.
Read more in the weekly update on COVID-19 vaccination figures.
19 April 2022 | 15:00 PM
Weekly update on the coronavirus SARS-CoV-2: 12 April to 19 april 2022
Last week, the number of new hospital admissions of patients with SARS-CoV-21 decreased by 53%* and the number of new patients with SARS-CoV-2 in the ICU decreased by 31%*, compared to the week before. The number of newly reported positive COVID-19 tests was also lower (-63%) last week compared to the week before that. Since last Monday, 11 April 2022, positive self-tests no longer need to be confirmed by the Municipal Public Health Services (GGDs). As a result, the number of people who get a GGD test to confirm a positive self-test will decrease. This means that the number of positive COVID-19 tests cannot be fully compared to previous weeks.
The reproduction number is below 1. See the Coronavirus Dashboard for graphs and information on the SARS-CoV-2 situation. Information on the SARS-CoV-2 situation in the Netherlands can also be found on the graphs page and in the epidemiological report, which is updated every week on Tuesdays.
From Saturday, 9 April 2022, no data will be published on weekends and public holidays* (days off). This is in line with the current situation regarding the coronavirus SARS-CoV-2. RIVM continues to monitor the development of the virus closely.
*Public holidays on which data will not be reported: New Year’s Day, Easter Sunday and Easter Monday, King’s Day, Liberation Day, Ascension Day, Whit Sunday and Whit Monday, Christmas Day and Boxing Day (in 2022: Saturday 1 January, Sunday 17 and Monday 18 April, Wednesday 27 April, Thursday 5 May, Thursday 26 May, Sunday 5 June and Monday 6 June, Sunday 25 and Monday 26 December).
| Last week | Two weeks ago | |
|---|---|---|
| Reports of people tested for SARS-CoV-2 who had a positive test result | ||
| Number of newly reported positive tests (by date as published by RIVM) |
24,7072 (137 per 100.000 inhabitants) |
66,7883 (373 per 100.000 inhabitants) |
|
Total new hospital admissions of patients with SARS-COV-2 (including ICU admissions)3 New hospital admissions of patients with SARS-CoV-2 (including ICU admissions) not including patients with an admission reason other than SARS-CoV-2 (Source: NICE)3,4 |
482*
378 |
1,017
827 |
|
Total new ICU admissions of patients with SARS-CoV-23 New ICU admissions not including patients with an admission reason other than SARS-CoV-2 (Source: NICE)4,5 |
50*
37 |
72
53 |
| Deaths6 | 52 | 81 |
| SARS-CoV-2 tests by the GGD per calendar week7,8 | week 15 | week 15 |
| Total number of tests of which results are known Number of positive tests Percentage of positive tests** |
41,359 24,150 |
110,655 67,772 |
| Number of tests intended to confirm a positive self-test9 Number of positive tests after a positive self-test Percentage of positive tests after a positive self-test |
18,719 17,058 91.1% |
52,561 48,733 92.7% |
| Number of tests not intended to confirm a positive self-test10 Number of positive tests not after a positive self-test Percentage of positive tests not after a positive self-test |
15,774 3,777 23.9% |
43,573 11,428 26.2% |
|
Number of tests for which it is unknown whether it was a confirmation test8 |
6,866 3,315 48.3% |
14,521 7,611 52.4% |
| Latest calculation | One week before | |
| Reproduction numbers11 | On 31 March 2022 | On 28 March 2022 |
| Based on reported positive tests | 0,71 (0,70 – 0,73) | 0,69 (0,68 – 0,70) |
| Based on hospital admissions (Source: NICE)12 | 0,89 (0,71 – 1,08) | 0,80 (0,65 – 0,97) |
| Based on ICU admissions (Source: NICE)12 | 1,02 (0,30 – 1,99) | 0,81 (0,18 – 1,63) |
12 April 2022 | 16:00
Repeat vaccination effective in preventing severe COVID-19
In the period from 1 February 2022 to 5 April 2022, vaccine effectiveness of the basic series of COVID-19 vaccinations in preventing hospital admission was 35%. After the booster vaccination, that percentage was 81%. Vaccine effectiveness against ICU admission was 45% after the basic series, compared to 90% after booster vaccination.
Read the news: Repeat vaccination effective in preventing severe COVID-19
12 April 2022 | 16:00
Vaccination figures 4-10 April 2022
Up to and including Sunday 10 April, more than 1.3 million repeat vaccinations had been administered. People aged 60 years and older, people living in nursing homes, and people with severely impaired immunity are eligible to get a repeat vaccination against COVID-19 three months after their last COVID-19 vaccination or three months after a SARS-CoV-2 infection. Vaccination coverage for the repeat vaccination among people over 60 has reached 28.5%.
Read more in the weekly update on COVID-19 vaccination figures.
12 April 2022 | 15:00 PM
Weekly update on the coronavirus SARS-CoV-2: 5 April to 12 april 2022
Last week, the number of new hospital admissions of patients with SARS-CoV-2 decreased by 29%* compared to the week before, and the number of new patients with SARS-CoV-2 in the ICU decreased by 20%*. The number of newly reported positive COVID-19 tests was also lower (-48%) last week compared to the week before that.
The reproduction number is below 1. See the Coronavirus Dashboard for graphs and information on the SARS-CoV-2 situation. Information on the SARS-CoV-2 situation in the Netherlands can also be found on the graphs page and in the epidemiological report, which is updated every week on Tuesdays.
From Saturday, 9 April 2022, no data will be published on weekends and public holidays* (days off). This is in line with the current situation regarding the coronavirus SARS-CoV-2. RIVM continues to monitor the development of the virus closely.
*Public holidays on which data will not be reported: New Year’s Day, Easter Sunday and Easter Monday, King’s Day, Liberation Day, Ascension Day, Whit Sunday and Whit Monday, Christmas Day and Boxing Day (in 2022: Saturday 1 January, Sunday 17 and Monday 18 April, Wednesday 27 April, Thursday 5 May, Thursday 26 May, Sunday 5 June and Monday 6 June, Sunday 25 and Monday 26 December).
| Last week | Two weeks ago | |
|---|---|---|
| Reports of people tested for SARS-CoV-2 who had a positive test result | ||
| Number of newly reported positive tests (by date as published by RIVM) |
66,7881 (373 per 100.000 inhabitants) |
129,1882 (739 per 100.000 inhabitants) |
|
Total new hospital admissions of patients with SARS-COV-2 (including ICU admissions)3 New hospital admissions of patients with SARS-CoV-2 (including ICU admissions) not including patients with an admission reason other than SARS-CoV-2 (Source: NICE)3,4 |
889
727 |
1,248
984 |
|
Total new ICU admissions of patients with SARS-CoV-23 New ICU admissions not including patients with an admission reason other than SARS-CoV-2 (Source: NICE)3,4 |
68
49 |
85
64 |
| Deaths5 | 81 | 113 |
| SARS-CoV-2 tests by the GGD per calendar week6,7 | week 14 | week 13 |
| Total number of tests of which results are known Number of positive tests Percentage of positive tests** |
110,655 67,773 |
220,511 135,073 |
| Number of tests intended to confirm a positive self-test*** Number of positive tests after a positive self-test Percentage of positive tests after a positive self-test |
52,561 48,733 92.7% |
161,646 94,991 93,5% |
| Number of tests not intended to confirm a positive self-test Number of positive tests not after a positive self-test Percentage of positive tests not after a positive self-test |
43,573 11,428 26.2% |
91,127 25,416 27.9% |
|
Number of tests for which it is unknown whether it was a confirmation test8 |
14,521 7,612 52.4% |
27,738 14,666 52.9% |
| Latest calculation | One week before | |
| Reproduction numbers9 | On 28 March 2022 | On 21 March 2022 |
| Based on reported positive tests | 0,69 (0,68 – 0,70) | 0,79 (0,78 – 0,80) |
| Based on hospital admissions (Source: NICE)10 | 0,0,80 (0,65 – 0,97) | 00,81 (0,67 – 0,95) |
| Based on ICU admissions (Source: NICE)9 | 0,81 (0,18 – 1,63) | 0,86 (0,34 – 1,53) |
5 April 2022 | 16:00
Vaccination figures: 28 March to 3 April 2022
Up to and including Sunday 3 April, more than 1 million repeat vaccinations had been administered. People aged 60 years and older, people living in nursing homes, and people with severely impaired immunity are eligible to get a repeat vaccination against COVID-19. They can get the repeat vaccination 3 months after their last COVID-19 vaccination or 3 months after a SARS-CoV-2 infection. As of this week, this report also includes vaccination coverage and the graph by age for the repeat vaccination against COVID-19. Vaccination coverage for the repeat vaccination among people over 60 has reached 22.4%.
Read more in the weekly update on COVID-19 vaccination figures.
5 April 2022 | 15:00 PM
Weekly update on the coronavirus SARS-CoV-2: 29 March to 5 April 2022
Last week, the number of new hospital admissions of patients with SARS-CoV-2 in the Netherlands decreased by 32%* compared to the week before, and the number of new patients with SARS-CoV-2 in the ICU decreased by 35%*. The number of newly reported positive COVID-19 tests was also lower (-42%) last week compared to the week before that. The reproduction number is below 1. See the Coronavirus Dashboard for graphs and information on the SARS-CoV-2 situation. Information on the SARS-CoV-2 situation in the Netherlands can also be found on the graphs page and in the epidemiological report, which is updated every week on Tuesdays.
From Saturday, 9 April 2022, no data will be published on weekends and public holidays* (days off). This is in line with the current situation regarding the coronavirus SARS-CoV-2. RIVM continues to monitor the development of the virus closely.
*Public holidays on which data will not be reported: New Year’s Day, Easter Sunday and Easter Monday, King’s Day, Liberation Day, Ascension Day, Whit Sunday and Whit Monday, Christmas Day and Boxing Day (in 2022: Saturday 1 January, Sunday 17 and Monday 18 April, Wednesday 27 April, Thursday 5 May, Thursday 26 May, Sunday 5 June and Monday 6 June, Sunday 25 and Monday 26 December).
| Last week | Two weeks ago | |
|---|---|---|
| Reports of people tested for SARS-CoV-2 who had a positive test result | ||
| Number of newly reported positive tests (by date as published by RIVM) |
129,1881 (739 per 100.000 inhabitants) |
222,3662 (1,264 per 100.000 inhabitants) |
|
Total new hospital admissions of patients with SARS-COV-2 (including ICU admissions)3 New hospital admissions of patients with SARS-CoV-2 (including ICU admissions) not including patients with an admission reason other than SARS-CoV-2 (Source: NICE)3,4 |
1,110
903 |
1,626
1,286 |
|
Total new ICU admissions of patients with SARS-CoV-23 New ICU admissions not including patients with an admission reason other than SARS-CoV-2 (Source: NICE)3,4 |
81
63 |
125
97 |
| Deaths5 | 113 | 104 |
| SARS-CoV-2 tests by the GGD per calendar week6,7 | week 13 | week 12 |
| Total number of tests of which results are known Number of positive tests Percentage of positive tests** |
220,512 135,073 |
331,247 216,610 |
| Number of tests intended to confirm a positive self-test*** Number of positive tests after a positive self-test Percentage of positive tests after a positive self-test |
101,646 94,991 93.5% |
161,107 152,047 94.4% |
| Number of tests not intended to confirm a positive self-test Number of positive tests not after a positive self-test Percentage of positive tests not after a positive self-test |
91,127 25,416 27.9% |
130,865 42,,387 32.4% |
|
Number of tests for which it is unknown whether it was a confirmation test8 |
27,739 14,666 52.9% |
39,275 22,176 56.5% |
| Latest calculation | One week before | |
| Reproduction numbers9 | On 21 March 2022 | On 14 March 2022 |
| Based on reported positive tests | 0,79 (0,78 – 0,80) | 0,82 (0,81 – 0,83) |
| Based on hospital admissions (Source: NICE)10 | 0,81 (0,67 – 0,95) | 0,88 (0,74 – 1,02) |
| Based on ICU admissions (Source: NICE)9 | 0,86 (0,34 – 1,53) | 0,94 (0,42 – 1,58) |
29 March 2022 | 16:40
Protection from COVID-19 booster remains high, but wanes slightly for everyone after 3 months
In the period from 1 February 2022 to 22 March 2022, when more than 99% of hospital admissions were caused by the Omicron variant, vaccine effectiveness of the basic series in preventing hospital admission was 45%. After the booster vaccination, that percentage was 82%. Vaccine effectiveness against ICU admission was 57% after the basic series, compared to 91% after booster vaccination.
Read the news: Protection from COVID-19 booster remains high, but wanes slightly for everyone after 3 months
29 March 2022 | 16:15
Vaccination figures 21 to 27 March 2022
As of 4 March 2022, people aged 70 years and older, people living in nursing homes, and certain groups of people with impaired immunity can get a repeat vaccination against COVID-19. As of 26 March, this option is available to people aged 60 years and older. Up to and including Sunday 27 March, more than 725,000 repeat vaccinations had been administered.
Read more in the weekly update on COVID-19 vaccination figures.
Weekly update on the coronavirus SARS-CoV-2: 22 to 29 March 2022
Last week, the number of new hospital admissions of patients with SARS-CoV-2 decreased by 19%* compared to the week before, and the number of new patients with SARS-CoV-2 in the ICU decreased by 9%*. The number of newly reported positive COVID-19 tests was also lower (-29%) last week compared to the week before that. The reproduction number is below 1. See the Coronavirus Dashboard for graphs and information on the SARS-CoV-2 situation. Information on the SARS-CoV-2 situation in the Netherlands can also be found on the graphs page and in the epidemiological report, which is updated every week on Tuesdays.
| Last week | Two weeks ago | |
|---|---|---|
| Reports of people tested for SARS-CoV-2 who had a positive test result | ||
| Number of newly reported positive tests (by date as published by RIVM) |
222,3661 (1,471 per 100.000 inhabitants) |
313,3182 (1,785 per 100.000 inhabitants) |
|
Total new hospital admissions of patients with SARS-COV-2 (including ICU admissions)3 New hospital admissions of patients with SARS-CoV-2 (including ICU admissions) not including patients with an admission reason other than SARS-CoV-2 (Source: NICE)3,4 |
1,471
1,195 |
1,825
1,450 |
|
Total new ICU admissions of patients with SARS-CoV-23 New ICU admissions not including patients with an admission reason other than SARS-CoV-2 (Source: NICE)3,4 |
118
92 |
129
102 |
| Deaths5 | 104 | 95 |
| SARS-CoV-2 tests by the GGD per calendar week6,7 | week 12 | week 11 |
| Total number of tests of which results are known Number of positive tests Percentage of positive tests** |
331,229 216,596 |
452,934 299,654 |
| Number of tests intended to confirm a positive self-test*** Number of positive tests after a positive self-test Percentage of positive tests after a positive self-test |
161,095 152,037 94.4% |
220,990 208,906 94.5% |
| Number of tests not intended to confirm a positive self-test Number of positive tests not after a positive self-test Percentage of positive tests not after a positive self-test |
130,861 42,385 32.4% |
181,758 61,982 34.1% |
|
Number of tests for which it is unknown whether it was a confirmation test8 |
39,273 22,174 56.5% |
61,982 28,766 57.3% |
| Latest calculation | One week before | |
| Reproduction numbers9 | On 14 March 2022 | On 7 March 2022 |
| Based on reported positive tests | 0,82 (0,81 – 0,83) | 0,87 (0,86 – 0,88) |
| Based on hospital admissions (Source: NICE)10 | 0,88 (0,74 – 1,02) | 0,96 (0,81 – 1,11) |
| Based on ICU admissions (Source: NICE)9 | 0,94 (0,42 – 1,58) | 1,03 (0,45 – 1,74) |
22 March 2022 | 16:30
Vaccination figures 14 to 20 March 2022
As of 4 March 2022, people aged 70 years and older, people living in nursing homes, and certain groups of people with impaired immunity can get a repeat vaccination against COVID-19. Up to and including Sunday 20 March, 429,000 repeat vaccinations had been administered.
Numbers and vaccination coverage for the basic series
By Sunday 20 March 2022, it is estimated that nearly 25 million first and second vaccinations in the basic series of COVID-19 vaccinations had been administered in the Netherlands. More than 133,000 third vaccinations were administered to people with severely impaired immunity.
It is estimated that 86.4% of all people over 18 have now completed the basic series. According to estimates, 84.9% of all people over 12 years old have completed the basic series.
Read more in the weekly update on COVID-19 vaccination figures.
22 March 2022 | 16:15 PM
Weekly update on the coronavirus SARS-CoV-2: 15 to 22 March 2022
Last week, there was a 7%* decrease in the number of new hospital admissions of patients with SARS-CoV-2. 15% more new COVID-19 patients were admitted to ICU compared to the week before*. The number of newly reported positive COVID-19 tests decreased by 27% last week compared to the week before that. Reported figures decreased in most age groups. The number of reported positive tests remained stable over the course of the week among people aged 70 years and older. However, even in that age group, the daily number of reported positive tests decreased during the week. The reproduction number is below 1.
See the Coronavirus Dashboard for graphs and information on the SARS-CoV-2 situation. Information on the SARS-CoV-2 situation in the Netherlands can also be found on the graphs page and in the epidemiological report, which is updated every week on Tuesdays. Much of the data used to keep track of the SARS-CoV-2 figures is available to the public. These open data files are published every day at 15:15.
| Last week | Two weeks ago | |
|---|---|---|
| Reports of people tested for SARS-CoV-2 who had a positive test result | ||
| Number of newly reported positive tests (by date as published by RIVM) |
313,3181 (1,785 per 100.000 inhabitants) |
429,2522 (2,451 per 100.000 inhabitants) |
|
Total new hospital admissions of patients with SARS-COV-2 (including ICU admissions)3 New hospital admissions of patients with SARS-CoV-2 (including ICU admissions) not including patients with an admission reason other than SARS-CoV-2 (Source: NICE)3,4 |
1,616
1,291 |
1,742
1,327 |
|
Total new ICU admissions of patients with SARS-CoV-23 New ICU admissions not including patients with an admission reason other than SARS-CoV-2 (Source: NICE)3,4 |
114
91 |
99
77 |
| Deaths5 | 95 | 104 |
| SARS-CoV-2 tests by the GGD per calendar week6,7 | week 11 | week 10 |
| Total number of tests of which results are known Number of positive tests Percentage of positive tests** |
452,936 299,654 |
625,710 414,245 |
| Number of tests intended to confirm a positive self-test*** Number of positive tests after a positive self-test Percentage of positive tests after a positive self-test |
220,987 208,891 94.5% |
304,322 286.467 94.1% |
| Number of tests not intended to confirm a positive self-test Number of positive tests not after a positive self-test Percentage of positive tests not after a positive self-test |
181,763 61,995 34.1% |
258,454 91,533 35.4% |
|
Number of tests for which it is unknown whether it was a confirmation test8 |
50,186 28,768 57.3% |
62,934 36,245 57.6% |
| Latest calculation | One week before | |
| Reproduction numbers9 | On 7 March 2022 | On 28 February 2022 |
| Based on reported positive tests | 0,87 (0,86 – 0,88) | 1,27 (1,26 – 1,28) |
| Based on hospital admissions (Source: NICE)10 | 0,96 (0,81 – 1,11) | 1,08 (0,92 – 1,26) |
| Based on ICU admissions (Source: NICE)9 | 1,03 (0,45 – 1,74) | 1,04 (0,40 – 1,81) |
15 March 2022 | 16:57 PM
Vaccination figures 7 to 13 March 2022
Numbers and vaccination coverage for the basic series
By Sunday 13 March 2022, it is estimated that more than 24.9 million first and second vaccinations in the basic series of COVID-19 vaccinations had been administered in the Netherlands. More than 133,000 third vaccinations were administered to people with severely impaired immunity.
It is estimated that 86.4% of all people over 18 have now completed the basic series. According to estimates, 84.9% of all people over 12 years old have completed the basic series
Read more in the weekly update on COVID-19 vaccination figures.
15 March 2022 | 16:45 PM
Weekly update on the coronavirus SARS-CoV-2: 8 march to 15 March 2022
Last week, there was a 14% increase in the number of new hospital admissions of patients with SARS-CoV-2. 6% more new COVID-19 patients were admitted to ICU compared to the week before. In the Netherlands as a whole, the number of newly reported positive COVID-19 tests remained fairly stable (-2%) compared to the week before that. Reported figures increased in 15 of the 25 GGD regions. In the Carnival regions, which had reported the biggest increase two weeks ago, the number of newly reported positive tests decreased in the past week. The daily number of positive tests decreased or stabilised during the past week, at national and regional levels. In most age groups, there was a slower increase in reported positive tests compared to the previous week. The number of reported positive tests continued to rise sharply among older people: 66% in the age group of 60-69 years, 104% in the age group of 70-79 years, and 102% among people over 80. Although the number of reported positive tests had remained stable two weeks ago among children aged 0-12 years, the number of reported positive tests in that age group increased by 33% last week. This may be due to increased testing after the holidays. The reproduction number is above 1.
See the Coronavirus Dashboard for graphs and information on the SARS-CoV-2 situation. Information on the SARS-CoV-2 situation in the Netherlands can also be found on the graphs page and in the epidemiological report, which is updated every week on Tuesdays. Much of the data used to keep track of the SARS-CoV-2 figures is available to the public. These open data files are published every day at 15:15.
| Last week | Two weeks ago | |
|---|---|---|
| Reports of people tested for SARS-CoV-2 who had a positive test result | ||
| Number of newly reported positive tests (by date as published by RIVM) |
429,2521 (1,545 per 100.000 inhabitants) |
439,7752 (1,356 per 100.000 inhabitants) |
| New hospital admissions (Source: NICE)3 | 1,545 | 1,356 |
| Of which new ICU admissions (Source: NICE)3 | 91 | 86 |
| Deaths4 | 104 | 56 |
| SARS-CoV-2 tests by the GGD per calendar week5,6 | week 10 | week 9 |
| Total number of tests of which results are known Number of positive tests Percentage of positive tests* |
625,649 414,212 66.2% |
597,192 417,867 70.0% |
| Number of tests intended to confirm a positive self-test** Number of positive tests after a positive self-test Percentage of positive tests after a positive self-test |
304,284 286,438 94.1% |
308,460 292.904 95.0% |
| Number of tests not intended to confirm a positive self-test7 Number of positive tests not after a positive self-test Percentage of positive tests not after a positive self-test |
258,437 91,532 35.4% |
234,190 92,099 39.3% |
|
Number of tests for which it is unknown whether it was a confirmation test7 |
62,928 36,242 57.6% |
54,542 32,864 60.3% |
| Latest calculation | One week before | |
| Reproduction numbers8 | On 28 February | On 21 February |
| Based on reported positive tests | 1,27 (1,26 – 1,28) | 1,00 (0,99 – 1,02) |
| Based on hospital admissions (Source: NICE)9 | 1,08 (0,92 – 1,26) | 0,97 (0,80 – 1,15) |
| Based on ICU admissions (Source: NICE)9 | 1,04 (0,40 – 1,81) | 0,94 (0,34 – 1,69) |
8 March 2022 | 16:30 PM
Vaccination figures 28 February 2022 to 6 March 2022
Numbers and vaccination coverage for the basic series
By Sunday 6 March 2022, it is estimated that more than 24.9 million first and second vaccinations in the basic series of COVID-19 vaccinations had been administered in the Netherlands. More than 133,000 third vaccinations were administered to people with severely impaired immunity.
It is estimated that 86.4% of all people over 18 have now completed the basic series. According to estimates, 84.9% of all people over 12 years old have completed the basic series.
Read more in the weekly update on COVID-19 vaccination figures.
8 March 2022 | 16:15 PM
Weekly update on the coronavirus SARS-CoV-2: 1 march to 8 March 2022
Significant increase in positive COVID-19 tests, rising highest in Carnival regions
After several weeks of decreasing figures in the Netherlands, the number of people who tested positive for SARS-CoV-2 in the past week rose to 439,775, from 245,898 a week before (+79%).
This significant increase is a combined effect of the Carnival week and the relaxed measures. Reported figures increased in all regions. In various areas in the provinces of Noord-Brabant and Limburg, reported positive tests per 100,000 inhabitants reached the highest point yet. Reported positive tests also increased in other regions, but less sharply, and the weekly number of reported positive tests did not exceed the levels observed during the Omicron wave in January and February 2022. The number of people who were tested by the Municipal Public Health Services (GGDs) increased by +60%, rising to 594,865 tests. At the GGD test sites in Noord-Brabant and Limburg, the waiting time to get tested is currently longer than usual.
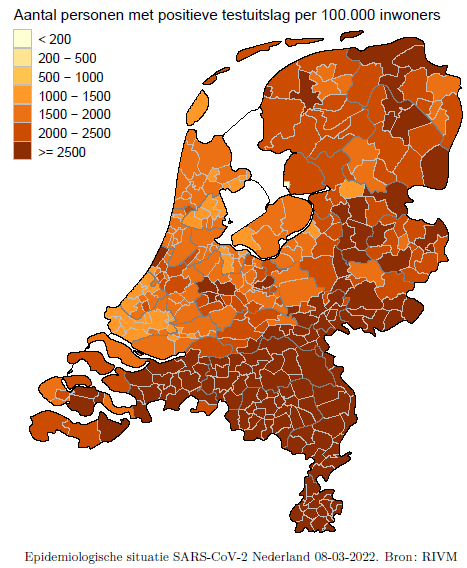
Figure 1: Map of newly reported positive COVID-19 tests per 100,000 inhabitants in the past week (1 March to 8 March 2022) by municipality.
The number of reported positive tests stabilised in the age group of 0-12 years. In all other age groups, the number of reported positive tests increased, doubling in the age groups of 18 to 24 years (+111%) and 25 to 29 years (+99%). Another striking trend this week is the major increase in the number of positive tests among people aged 60 years and over compared to a week before. During the Omicron wave in the first two months of this year, infections among this age group in particular remained stable and low compared to the large number of infections among younger age groups.
Last week, the number of new hospital admissions of patients with SARS-CoV-2 stabilised compared to the week before, and there were 16% fewer new patients in the ICU than in the week before that. On average, the impact of a rising infection rate on the number of hospital admissions becomes apparent about two weeks later. Because vulnerable people and older people have a higher risk of hospital admission after infection with the coronavirus SARS-CoV-2, they are strongly advised to take additional precautions to protect themselves (see Recommendations for vulnerable groups | RIVM.nl) and to get the booster vaccination or repeat booster against COVID-19.
All the weekly COVID-19 figures are presented in a table and in graphs on the RIVM website and in the weekly epidemiological update. A great deal of information can also be found on the Coronavirus Dashboard.
| Last week | Two weeks ago | |
|---|---|---|
| Reports of people tested for SARS-CoV-2 who had a positive test result | ||
| Number of newly reported positive tests (by date as published by RIVM) |
439,7751 (2.517 per 100.000 inhabitants) |
245,8982 (1.408 per 100.000 inhabitants) |
| New hospital admissions (Source: NICE)3 | 1,171 | 1,118 |
| Of which new ICU admissions (Source: NICE)3 | 82 | 98 |
| Deaths4 | 56 | 63 |
| SARS-CoV-2 tests by the GGD per calendar week5,6 | week 9 | week 8 |
| Total number of tests of which results are known Number of positive tests Percentage of positive tests* |
594,865 416,141 70.0% |
372,354 233,193 62.6% |
| Number of tests intended to confirm a positive self-test** Number of positive tests after a positive self-test Percentage of positive tests after a positive self-test |
307,146 291,637 95.0% |
175,522 164,184 93.5% |
| Number of tests not intended to confirm a positive self-test7 Number of positive tests not after a positive self-test Percentage of positive tests not after a positive self-test |
233,333 91,748 39.3% |
166,809 53,670 32.2% |
|
Number of tests for which it is unknown whether it was a confirmation test7 |
54,386 32,756 60.2% |
30,023 15,339 51.1% |
| Latest calculation | One week before | |
| Reproduction numbers8 | On 21 February | On 14 February |
| Based on reported positive tests | 1,00 (0,99 – 1,02) | 0,77 (0,76 – 0,78) |
| Based on hospital admissions (Source: NICE)9 | 0,97 (0,80 – 1,15) | 0,95 (0,80 – 1,12) |
| Based on ICU admissions (Source: NICE)9 | 0,94 (0,34 – 1,69) | 0,98 (0,41 – 1,69) |
2 March 2022 | 9:15
Booster vaccination offers effective protection against hospital and ICU admission due to COVID-19
From 1 December 2021 to 22 February 2022, vaccine effectiveness for the COVID-19 booster vaccination was 94% against hospital admission and 98% against ICU admission.
Read the news: Booster vaccination offers effective protection against hospital and ICU admission due to COVID-19
1 March 2022 | 16:00
Vaccination figures 21 to 27 February 2021
Number of vaccinations in the basic series
By Sunday 27 February 2022, it is estimated that more than 24.9 million first and second vaccinations in the basic series of COVID-19 vaccinations had been administered in the Netherlands. About 13.5 million of those were first vaccinations, and nearly 11.5 million were second vaccinations. More than 133,000 third vaccinations were administered to people with severely impaired immunity.
Read more in the Weekly update on COVID-19 vaccination figures.
1 March 2022 | 15:00 PM
Weekly update on the coronavirus SARS-CoV-2: 22 February to 1 March 2022
Last week, there were 26% fewer new hospital admissions and 15% fewer new ICU admissions of patients with SARS-CoV-2 compared to the week before. The number of newly reported positive COVID-19 tests decreased by 21% last week compared to the week before that. The reproduction number is below 1.
See the Coronavirus Dashboard for graphs and information on the SARS-CoV-2 situation. Information on the SARS-CoV-2 situation in the Netherlands can also be found on the graphs page and in the epidemiological report, which is updated every week on Tuesdays. Much of the data used to keep track of the SARS-CoV-2 figures is available to the public. These open data files are published every day at 15:15.
| Last week | Two weeks ago | |
|---|---|---|
| Reports of people tested for SARS-CoV-2 who had a positive test result | ||
| Number of newly reported positive tests (by date as published by RIVM) |
245,8981 (1,408 per 100,000 inhabitants) |
310,1442 (1,764 per 100,000 inhabitants) |
| New hospital admissions (Source: NICE)3 | 998 | 1,349 |
| Of which new ICU admissions (Source: NICE)3 | 88 | 104 |
| Deaths4 | 63 | 95 |
| SARS-CoV-2 tests by the GGD per calendar week5,6 | week 8 | week 7 |
| Total number of tests of which results are known Number of positive tests Percentage of positive tests* |
372,349 233,192 62.6% |
519,494 302,859 58.3% |
| Number of tests intended to confirm a positive self-test** Number of positive tests after a positive self-test Percentage of positive tests after a positive self-test |
175,520 164,184 93.5% |
225,919 207,249 91.7% |
| Number of tests not intended to confirm a positive self-test7 Number of positive tests not after a positive self-test Percentage of positive tests not after a positive self-test |
166,806 53,669 32.1% |
254.320 76,568 30.1% |
|
Number of tests for which it is unknown whether it was a confirmation test7 |
30,023 15,339 51,1% |
39,255 19,042 48.5% |
| Latest calculation | One week before | |
| Reproduction numbers8 | On 14 February | On 7 February |
| Based on reported positive tests | 0,77 (0,76 – 0,78) | 0,83 (0,82 – 0,84) |
| Based on hospital admissions (Source: NICE)9 | 0,95 (0,80 – 1,12) | 0,99 (0,84 – 1,16) |
| Based on ICU admissions (Source: NICE)9 | 0,98 (0,41 – 1,69) | 1,01 (0,45– 1,73) |
22 February 2022 | 16:00
Vaccination figures 14 to 20 February 2021
Number of vaccinations in the basic series
By Sunday 20 February 2022, it is estimated that more than 24.9 million first and second vaccinations in the basic series of COVID-19 vaccinations had been administered in the Netherlands. More than 13.4 million of those were first vaccinations, and more than 11.4 million were second vaccinations. More than 133,000 third vaccinations were administered to people with severely impaired immunity.
Read more in the Weekly update on COVID-19 vaccination figures.
22 February 2022 | 16:10 PM
Weekly update on the coronavirus SARS-CoV-2: 15 February to 22 February 2022
Read the news: Decrease in SARS-CoV-2 hospital admissions, fewer people tested
| Last week | Two weeks ago | |
|---|---|---|
| Reports of people tested for SARS-CoV-2 who had a positive test result | ||
| Newly reported positive tests (by date as published by RIVM)* |
310,1441 (1,764 per 100,000 inhabitants) |
493,0552 (2,791 per 100,000 inhabitants) |
| New hospital admissions (Source: NICE)3 | 1,214 | 1,381 |
| Of which new ICU admissions (Source: NICE)3 | 97 | 95 |
| Deaths4 | 95 | 78 |
| SARS-CoV-2 tests by the GGD per calendar week5,6 | week 7 | week 6 |
| Total number of tests of which results are known Number of positive tests Percentage of positive tests* |
519,444 302,822 58.3% |
833.269 480,093 57.6% |
| Number of tests intended to confirm a positive self-test** Number of positive tests after a positive self-test Percentage of positive tests after a positive self-test |
225,884 207,218 91.7% |
351,526 319,488 90.9% |
| Number of tests not intended to confirm a positive self-test7 Number of positive tests not after a positive self-test Percentage of positive tests not after a positive self-test |
254,308 76,564 30.1% |
413,807 127,317 30.8% |
|
Number of tests for which it is unknown whether it was a confirmation test7 |
39.,52 19,040 48.5% |
67,936 33,288 49.0% |
| Latest calculation | One week before | |
| Reproduction numbers8 | On 7 February | On 31 January |
| Based on reported positive tests | 0,83 (0,82 – 0,84) | 0,98 (0,97 – 0,99) |
| Based on hospital admissions (Source: NICE)9 | 0,99 (0,84 – 1,16) | 0,97 (0,81 – 1,14) |
| Based on ICU admissions (Source: NICE)9 | 1,01 (0,45– 1,73) | 0,94 (0,39 – 1,63) |
1
5 February 2022 | 17:20
Booster vaccination prevents many hospital and ICU admissions
In the period from 26 January to 8 February 2022, the COVID-19 vaccines were 92% effective in preventing hospital admission after the booster, and 55% effective after the basic vaccinations. During this period, the vast majority of hospital admissions were caused by the Omicron variant of the coronavirus SARS-CoV-2.
Read the news: Booster vaccination prevents many hospital and ICU admissions
15 February 2022 | 17:00
Vaccination figures 7 to 13 February 2021
Number of vaccinations in the basic series
By Sunday 13 February 2022, it is estimated that more than 24.9 million first and second vaccinations in the basic series of COVID-19 vaccinations had been administered in the Netherlands. More than 13.4 million of those were first vaccinations, and more than 11.4 million were second vaccinations. About 133,000 third vaccinations have been administered to people with severely impaired immunity.
Read more in the Weekly update on COVID-19 vaccination figures.
15 February 2022 | 16:50 PM
Weekly update on the coronavirus SARS-CoV-2: 8 February to 15 February 2022
Read the news: Omicron subvariant BA.2 becomes dominant, decrease in hospital admissions
| Last week | Two weeks ago | |
|---|---|---|
| Reports of people tested for SARS-CoV-2 who had a positive test result | ||
| Newly reported positive tests (by date as published by RIVMNational Institute for Public Health and the Environment)* | 493,0551 | 824,3042 |
| Newly reported positive tests (by date of positive test result) |
482,6953 (2,762 per 100,000 inhabitants) |
616,3954 (3,527 per 100,000 inhabitants) |
| New hospital admissions (Source: NICE)5 | 1,149 | 1,393 |
| Of which new ICU admissions (Source: NICE)5 | 88 | 122 |
| Deaths6 | 78 | 54 |
| SARS-CoV-2 tests by the GGD per calendar week7,8 | week 6 | week 5 |
| Total number of tests of which results are known Number of positive tests Percentage of positive tests** |
833,178 480,038 57,6% |
977,734 593,316 60.7% |
| Number of tests intended to confirm a positive self-test*** Number of positive tests after a positive self-test Percentage of positive tests after a positive self-test |
351,486 308,698 90.9% |
425,289 388,533 91.4% |
| Number of tests not intended to confirm a positive self-test Number of positive tests not after a positive self-test Percentage of positive tests not after a positive self-test |
413,753 127,288 30.8% |
447,746 149,664 33.4% |
|
Number of tests for which it is unknown whether it was a confirmation test9 |
67,939 33,291 49.0% |
104,699 55,119 52.6% |
| Latest calculation | One week before | |
| Reproduction numbers10 | On 31 January | On 24 January |
| Based on reported positive tests | 0.98 (0.97 – 0.99) | 1.11 (1.10 – 1.11) |
| Based on hospital admissions (Source: NICE) | 0.97 (0.81 – 1.14) | 1.08 (0.91 – 1.27)**** |
| Based on ICU admissions (Source: NICE) | 0.94 (0.39 – 1.63) | 1.13 (0.49 – 1.99)**** |
8 February 2022 | 19:45 PM
Weekly update on the coronavirus SARS-CoV-2: 1 February to 8 February 2022
Read the news: Increase in COVID-19 hospital admissions, positive tests reaching high plateau
| Last week | Two weeks ago | |
|---|---|---|
| Reports of people tested for SARS-CoV-2 who had a positive test result | ||
| Newly reported COVID-19 infections (by date as published by RIVMNational Institute for Public Health and the Environment)* | 824,3041 | 539,0152 |
| Newly reported COVID-19 infections (by date of positive test result) |
608,5293 (3,399 per 100,000 inhabitants) |
594,0604 (3,482 per 100,000 inhabitants) |
| New hospital admissions (Source NICE)5 | 1,266 | 1,185 |
| Of which new ICU admissions (Source: NICE)5 | 118 | 83 |
| Deaths6 | 54 | 66 |
| SARS-CoV-2 tests by the GGD per calendar week7,8 | week 5 | week 4 |
| Total number of tests of which results are known Number of positive tests Percentage of positive tests** |
977,564 593,220 60,7% |
1,019,986 572,229 56.1% |
| Number of tests intended to confirm a positive self-test*** Number of positive tests after a positive self-test Percentage of positive tests after a positive self-test |
425,216 388,476 91.4% |
370,480 337,479 91.1% |
| Number of tests not intended to confirm a positive self-test Number of positive tests not after a positive self-test Percentage of positive tests not after a positive self-test |
447,682 149,640 33.4% |
518,329 168,899 32.6%% |
|
Number of tests for which it is unknown whether it was a confirmation test9 |
104,666 55,104 52.6% |
131,177 65,751 50.1% |
| Latest calculation | One week before | |
| Reproduction numbers10 | On 24 January | On 17 January |
| Based on reported positieve tests**** | 1.11 (1.10 – 1.11) | 1.20 (1.19 – 1.21) |
| On 22 January11 | On 15 January | |
| Based on hospital admissions (Source: NICE) | 1.08 (0.91 – 1.27) | 1.12 (0.93 – 1.31) |
| Based on ICU admissions (Source: NICE) | 1.13 (0.49 – 1.99) | 1.08 (0.45 – 1.81) |
8 February 2022 | 16:00
Vaccination figures: 31 January 2022 to 6 February 2022
Number of vaccinations in the basic series
By Sunday 6 February 2022, it is estimated that more than 24.9 million first and second vaccinations in the basic series of COVID-19 vaccinations had been administered in the Netherlands. More than 13.4 million of those were first vaccinations, and more than 11.4 million were second vaccinations. About 133,000 third vaccinations have been administered to people with severely impaired immunity.
Read more in the Weekly update on COVID-19 vaccination figures.
8 February 2022 | 14:00
Slight delay in weekly update on reported positive tests
The weekly update on positive tests and hospital admissions that RIVM normally posts on Tuesday around 15:00 hrs, and the accompanying open data, will be published later today.
The number of reported positive COVID-19 tests rose dramatically over the past few weeks. Due to the high volume of positive test results, the Municipal Public Health Services (GGDs) has experienced delays in transmitting these figures to RIVM since 18 January 2022. As a result, the actual number of reported positive tests was higher than the numbers reported daily by RIVM. The reported positive tests from the GGD test lanes were first entered into a GGD system. From there, the reported positive test results were transferred to a second GGD system, where information from source and contact tracing was entered by hand. As of today, reported figures on positive tests will be sent directly from the GGD test lanes to RIVM; this includes the new reported positive tests and the previous positive tests that were not yet reported to RIVM. As a result of this catch-up action, RIVM will be reporting a particularly high number of positive tests today. Today’s weekly news item on COVID-19 figures will be delayed slightly, and is expected to be published between 16:00 and 16:30 hrs.
1 February 2022 | 19:00
Booster vaccination still very effective
From 1 December 2021 to 25 January 2022, vaccine effectiveness for the COVID-19 booster vaccination was 97% against hospital admission and 98% against ICU admission.
A booster vaccination provides more protection against hospital admission than only completing the basic series of COVID-19 vaccinations: 97% compared to 83%. This means that the risk of hospital admission after a booster vaccination is 33 times lower compared to no COVID-19 vaccinations and 5 times lower compared to a completed basic series without a booster.
Read more about Booster vaccination still very effective
1 February 2022 | 16:00
Vaccination figures: 24 to 30 January 2022
Number of vaccinations in the basic series
By Sunday 30 January 2022, it is estimated that more than 24.8 million first and second vaccinations in the basic series of COVID-19 vaccinations had been administered in the Netherlands. More than 13.4 million of those were first vaccinations, and more than 11.4 million were second vaccinations. Nearly 133,000 third vaccinations have been administered to people with severely impaired immunity.
Read more in the Weekly update on COVID-19 vaccination figures.
1 February 2022 | 4:00 PM
Weekly update on the coronavirus SARS-CoV-2: 25 January to 1 February 2022
Read the news: Over half a million positive COVID-19 tests, more hospital admissions
| Last week1 | Two weeks ago2 | |
|---|---|---|
| Reports of people tested for SARS-CoV-2 who had a positive test result | ||
| Newly reported COVID-19 infections* |
530,015 (2,817 per 100,000 inhabitants) |
366,120 (2,034 per 100,000 inhabitants) |
| New hospital admissions (Source NICE)3 | 1,056 | 951 |
| Of which new ICU admissions (Source: NICE)3 | 78 | 66 |
| Deaths4 | 66 | 61 |
| SARS-CoV-2 tests by the GGD per calendar week5,6 | week 4 | week 3 |
| Total number of tests of which results are known Number of positive tests Percentage of positive tests** |
1,019,496 571,920 56.1% |
950,160 431,659 45.4% |
| Number of tests intended to confirm a positive self-test*** Number of positive tests after a positive self-test Percentage of positive tests after a positive self-test |
370,252 305,196 91.1% |
241,851 218,344 90.3% |
| Number of tests not intended to confirm a positive self-test Number of positive tests not after a positive self-test Percentage of positive tests not after a positive self-test |
518,109 168,816 32.6% |
566,320 152,968 27.0%% |
|
Number of tests for which it is unknown whether it was a confirmation test7 |
131,135 65,730 50.1% |
141,989 60,347 42.5% |
| Latest calculation | One week before | |
| Reproduction numbers8 | On 17 January | On 10 January |
| Based on reported infections | 1.20 (1.19 – 1.21) | 1.19 (1.18 – 1.20) |
| On 15 January**** | On 18 January | |
| Based on hospital admissions (Source: NICE) | 1.12 (0.93 – 1.31) | 0.99 (0.80 – 1.19) |
| Based on ICU admissions (Source: NICE) | 1.08 (0.45 – 1.81) | 0.85 (0.38 – 1.44) |
28 January 2022 | 17:45
Update on backlog in positive COVID-19 tests
The backlog in the daily number of reported positive COVID-19 tests is currently about 72,000. This is due to the current high numbers of positive tests. All positive test results are entered into a system by the Municipal Public Health Services (GGDs). From that GGD system, the reported positive test results are then transferred to a second GGD system, where information from source and contact tracing is entered by hand. Due to the high volume of reported positive tests, entering this information takes a lot of work. Many aspects of this process have already been automated by the GGD recently, but the technical solution is not yet working optimally. As a result, there is a delay in sending the data from the GGD to RIVMNational Institute for Public Health and the Environment.
They are working to resolve the delay. It is expected to be resolved next week.
25 January 2022 | 16:45
Vaccination figures: 17 to 23 January 2022
As of this week, the COVID-19 updates also include the number of vaccinations in the basic series and the number of booster vaccinations. In addition to vaccination coverage for the basic series, this update now also includes booster vaccination coverage by age group.
Read more in the Weekly update on COVID-19 vaccination figures.
25 January 2022 | 4:00 PM
Weekly update on the coronavirus SARS-CoV-2: 18 January to 25 January 2022
The number of reported positive COVID-19 tests increased by 51% last week compared to the week before that, rising to 366,120. Since 18 January 2022, an estimated 60,000 positive COVID-19 tests have not yet been reported to RIVMNational Institute for Public Health and the Environment as a result of the huge volume of positive test results at the Municipal Public Health Services (GGDs).* Based on the positive tests reported to RIVM in the past week, the biggest increase in reported positive tests per 100,000 inhabitants was seen among children and adolescents in the primary school (+161%) and secondary school (+112%) age groups. There was also a clear increase in the number of positive COVID-19 tests among people in their thirties (+42%) and forties (+42%). The number of positive COVID-19 tests decreased in the age group of 18-24 years (-13%) (see Figure 1).The other age groups showed relatively minor differences from one week to the next. The number of people who were tested by the GGD increased by 37 in the past calendar week, compared to the week before that. After a period in which figures decreased, hospital admissions rose again in the past week. 855* new hospital admissions were reported last week, an increase of +15% compared to the week before that. This seems to mark a trend shift, with hospital admissions moving into an upward trend again. 65 new patients were admitted to ICU last week, a decrease of 34% compared to the week before that. The reproduction number based on the number of positive COVID-19 tests reported to RIVM* is still well below 1.
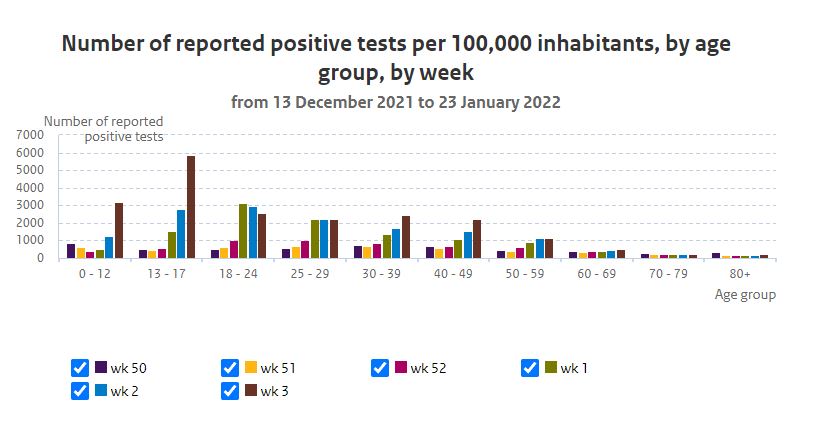
* There is currently a backlog in the daily number of positive COVID-19 tests reported by RIVMNational Institute for Public Health and the Environment, compared to the actual figures reported by the Municipal Public Health Services (GGD). Numbers are currently so high that it is causing delays in sending the figures from the GGD system to RIVM. These figures do not include about 60,000 positive tests that were reported between 18 and 25 January 2022. A technical solution is being developed to catch up and eliminate this backlog, but it will take some time. The reproduction number based on reported infections may temporarily be too low due to the backlog, which will be corrected when the delayed reports have been incorporated.
** The NICE Foundation and the hospitals cannot yet distinguish between the number of patients who were admitted due to COVID-19 and the number of patients admitted to hospital who tested positive for SARS-CoV-2, but were admitted for another reason. They are working on a solution for that.
| Last week1 | Two weeks ago2 | |
|---|---|---|
| Reports of people tested for SARS-CoV-2 who had a positive test result | ||
| Newly reported COVID-19 infections* |
366,120 (2,034 per 100,000 inhabitants) |
242,961 (1,380 per 100,000 inhabitants) |
| New hospital admissions (Source NICE)3 | 855 | 741 |
| Of which new ICU admissions (Source: NICE)3 | 65 | 99 |
| Deaths4 | 61 | 63 |
| SARS-CoV-2 tests by the GGD per calendar week5,6 | week 3 | week 2 |
| Total number of tests of which results are known Number of positive tests Percentage of positive tests** |
949,034 431,549 45.4% |
695,512 256,115 36.8% |
| Number of tests intended to confirm a positive self-test*** Number of positive tests after a positive self-test Percentage of positive tests after a positive self-test |
241.779 218,286 90.3% |
137.306 120.778 88.0% |
| Number of tests not intended to confirm a positive self-test Number of positive tests not after a positive self-test Percentage of positive tests not after a positive self-test |
566,223 152,932 27.0% |
451,249 98.780 21.9% |
|
Number of tests for which it is unknown whether it was a confirmation test7 |
141,932 60,331 42.5% |
106,957 36,557 34.1% |
| Latest calculation | One week before | |
| Reproduction numbers8 | On 10 January | On 3 January |
| Based on reported infections | 1,19 (1,18 – 1,20) | 1,16 (1,14 – 1,17) |
| On 8 January**** | On 1 January | |
| Based on hospital admissions (Source: NICE) | 0,99 (0,80 – 1,19) | 0,95 (0,77 – 1,14) |
| Based on ICU admissions (Source: NICE) | 0,85 (0,38 – 1,44) | 0,92 (0,50 – 1,44) |
25 January 2022 | 11:15 AM
Shorter serial interval for Omicron variant
The Omicron variant of the coronavirus SARS-CoV-2 spreads faster than the Delta variant. Researchers from RIVM conclude in a preprint article that this faster spread can be attributed at least partly to the fact that the Omicron variant appears to have a shorter serial interval. This is the time between the first day of illness for the source contact and the first day of illness for the person they infect. The researchers reached this conclusion by looking at infections within households. On a PCR test, the Omicron variant shows S-gene target failure (SGTF, also known as ‘S-dropout’) while the Delta variant does not. Researchers looked at the serial interval of households where S-dropout did or did not occur. The serial interval was 3.4 days in households that showed S-dropout on the PCR tests, and 3.9 days in households without S-dropout. That means that the serial interval is a half-day shorter for the Omicron variant compared to the Delta variant.
More information: Shorter serial intervals in SARS-CoV-2 cases with Omicron variant compared to Delta variant in the Netherlands, 13 - 19 December 2021 | medRxiv
20 January 2022 | 17:00 hrs
Backlog in figures for reported number of COVID-19 cases
There is currently a significant backlog in the daily number of positive COVID-19 tests reported by RIVM, compared to the actual figures reported by the Municipal Health Services (GGD). Numbers are currently so high that it is causing delays in transferring the figures from the GGD system to RIVM. The figures therefore do not yet include about 27,000 positive tests that were reported over the past three days. A technical solution is being developed to catch up and eliminate this backlog, but it will take some time. Therefore, the weekly RIVM update is currently the best way to monitor the course of the epidemic.
19 January 2022 | 4:00 PM
Booster vaccination very effective in preventing severe COVID-19
After a booster vaccination, the chance that a person infected with the coronavirus SARS-CoV-2 would be admitted to hospital was 33 times lower than for an unvaccinated person, and 5 times lower than for a person who had completed the basic series without a booster. The chance of ICU admission was 50 times lower after a booster compared to someone who is unvaccinated, and 4 times lower than for someone who had completed the basic series without a booster.*
Effectiveness of booster vaccination in preventing hospital and ICU admission
The booster vaccination campaign in the Netherlands started on 18 November 2021. For the first time, RIVM can now provide an update on the effectiveness of booster vaccination in preventing hospital and ICU admission. From 19 November 2021 to 13 January 2022, vaccine effectiveness for people who had received a booster vaccination was 97% against hospital admission and 98% against ICU admission.
Read more about Booster vaccination very effective in preventing severe COVID-19
18 January 2022 | 4:00 PM
Vaccination figures: 10 to 16 January 2022
By Sunday 16 January 2022, it is estimated that more than 24.7 million first and second vaccinations had been administered in the Netherlands. More than 13.3 million of those were first vaccinations, and more than 11.4 million were second vaccinations.
Read more about COVID-19 vaccination figures.
18 January 2022 | 3:50 PM
Weekly update on the coronavirus SARS-CoV-2: 11 January to 18 January 2022
Read the news: Nearly a quarter-million positive COVID-19 tests last week
| Last week1 | Two weeks ago2 | |
|---|---|---|
| Reports of people tested for SARS-CoV-2 who had a positive test result | ||
| Newly reported COVID-19 infections* |
242,961 (1,380 per 100,000 inhabitants) |
201,536 (1,147per 100,000 inhabitants) |
| New hospital admissions (Source NICE)3 | 647 | 940 |
| Of which new ICU admissions (Source: NICE)3 | 94 | 146 |
| Deaths4 | 63 | 116 |
| SARS-CoV-2 tests by the GGD per calendar week5,6 | week 2 | week 1 |
| Total number of tests of which results are known Number of positive tests Percentage of positive tests** |
695,378 256,035 36.8% |
589,657 201,388 34.2% |
| Number of tests intended to confirm a positive self-test*** Number of positive tests after a positive self-test Percentage of positive tests after a positive self-test |
137,264 120,740 88.0% |
102,171 90,240 88.3% |
| Number of tests not intended to confirm a positive self-test Number of positive tests not after a positive self-test Percentage of positive tests not after a positive self-test |
451,160 98,739 21.9% |
390,425 80,791 20.7% |
|
Number of tests for which it is unknown whether it was a confirmation test7 |
106,954 36,556 34.2% |
97,061 30,357 31.2% |
| Latest calculation | One week before | |
| Reproduction numbers8 | On 3 January | On 27 December |
| Based on reported infections | 1,16 (1,14 – 1,17) | 1,26 (1,24 – 1,28) |
| On 1 January**** | On 25 December | |
| Based on hospital admissions (Source: NICE) | 0,95 (0,77 – 1,14) | 0,95 (0,78 – 1,12) |
| Based on ICU admissions (Source: NICE) | 0,92 (0,50 – 1,44) | 0,92 (0,53 – 1,38) |
15 January 2022 | 09:00 AM
Advisory report of 138th OMT
On 12 January 2022, the Outbreak Management Team (OMT) convened to consult on the COVID-19 epidemic. Among other topics, the OMT discussed the following during this meeting:
- the latest epidemiologcal data on the coronavirus SARS-CoV-2;
- the expected course of the epidemic;
- the projected consequences of any relaxations in measures taken to prevent the spread of the virus;
- the use of face masks that cover the mouth and nose in public spaces;
- a change in the quarantine rules, allowing workers in crucial & vital professions to leave quarantine for work (after a negative self-test).
Read more in the advisory report of the 138th OMT (in Dutch).
11 January 2022 | 4:15 PM
Vaccination figures: 3 to 9 January 2022
Read more about COVID-19 vaccination figures.
11 January 2022 | 3:50 PM
Weekly update on the coronavirus SARS-CoV-2: 4 January to 11 January 2022
Read the news: 200 thousand people tested positive in one week
| Last week1 | Two weeks ago2 | |
|---|---|---|
| Reports of people tested for SARS-CoV-2 who had a positive test result | ||
| Newly reported COVID-19 infections* |
201,536 (1,147 per 100,000 inhabitants) |
113,554 (639 per 100,000 inhabitants) |
| New hospital admissions (Source NICE)3 | 873 | 1,046 |
| Of which new ICU admissions (Source: NICE)3 | 143 | 171 |
| Deaths4 | 116 | 189 |
| SARS-CoV-2 tests by the GGD per calendar week5,6 | week 1 | week 52 |
| Total number of tests of which results are known Number of positive tests Percentage of positive tests* |
589,564 201,353 34.2% |
354,386 109,226 30.8% |
| Number of tests intended to confirm a positive self-test** Number of positive tests after a positive self-test Percentage of positive tests after a positive self-test |
102,141 90,220 88.3% |
57,238 50,657 88.5% |
| Number of tests not intended to confirm a positive self-test Number of positive tests not after a positive self-test Percentage of positive tests not after a positive self-test |
390,373 80,779 20.7% |
238,898 42,335 17.7% |
|
Number of tests for which it is unknown whether it was a confirmation test7 |
97,050 30,354 31.3% |
58,250 16,234 27.9% |
| Latest calculation | One week before | |
| Reproduction numbers8 | On 27 December | On 20 December |
| Based on reported infections | 1.26 (1.24 – 1.28) | 1.02 (1.00 – 1.03) |
| On 25 December*** | On 18 December | |
| Based on hospital admissions (Source: NICE) | 0.95 (0.78 – 1.12) | 0.95 (0.80 – 1.11) |
| Based on ICU admissions (Source: NICE) | 0.92 (0.53 – 1.38) | 0.95 (0.58 – 1.37) |
10 January 2022 | 21:19 PM
OMT advisory report, 7 January 2022
On 7 January 2022, the Outbreak Management Team (OMT) convened to consult on the COVID-19 outbreak. The OMT studied the latest epidemiological data on the coronavirus SARS-CoV-2 and issued an advisory report on the use of face masks that cover the mouth and nose.
Read more in the advisory report of the 137th OMT (in Dutch). More information on the OMT can be found on the RIVM page about the Outbreak Management Team.
4 January 2022 | 4:15 PM
Weekly update on the coronavirus SARS-CoV-2: 28 December 2021 to 4 January 2022
Read the news: Omicron causes 35% increase in positive COVID-19 tests, despite lockdown
| Last week1 | Two weeks ago2 | |
|---|---|---|
| Reports of people tested for SARS-CoV-2 who had a positive test result | ||
| Newly reported COVID-19 infections* |
113,554 (639 per 100,000 inhabitants) |
84,398 (482 per 100,000 inhabitants) |
| New hospital admissions (Source NICE)3 | 981 | 1,137 |
| Of which new ICU admissions (Source: NICE)3 | 164 | 196 |
| Deaths4 | 189 | 272 |
| SARS-CoV-2 tests by the GGD per calendar week5,6 | week 52 | week 51 |
| Total number of tests of which results are known Number of positive tests Percentage of positive tests* |
354,335 109,210 30.8% |
346,722 81,000 23.4% |
| Number of tests intended to confirm a positive self-test** Number of positive tests after a positive self-test Percentage of positive tests after a positive self-test |
57,230 50,650 88.5% |
46,936 39,674 84.5% |
| Number of tests not intended to confirm a positive self-test Number of positive tests not after a positive self-test Percentage of positive tests not after a positive self-test |
238,871 42,328 17.7% |
240,155 28,739 12.0% |
|
Number of tests for which it is unknown whether it was a confirmation test7 |
58,234 16,232 27.9% |
59,631 12,587 21.1% |
| Latest calculation | One week before | |
| Reproduction numbers8 | On 20 December | On 13 December |
| Based on reported infections | 1.02 (1.00 – 1.03) | 0.90 (0.89 – 0.92) |
| On 18 December*** | On 11 December | |
| Based on hospital admissions (Source: NICE) | 0.95 (0.80 – 1.11) | 0.90 (0.77 – 1.04) |
| Based on ICU admissions (Source: NICE) | 0.95 (0.58 – 1.37) | 0.88 (0.56 – 1.25) |
4 January 2022| 4:00 PM
Vaccination figures: 27 December 2021 - 2 January 2022
By Sunday 2 January 2022, it is estimated that more than 24.7 million first and second vaccinations had been administered in the Netherlands. More than 13.3 million of those were first vaccinations, and nearly 11.4 million were second vaccinations.
Read more about COVID-19 vaccination figures.